## Diagram: Neural Network Architecture
### Overview
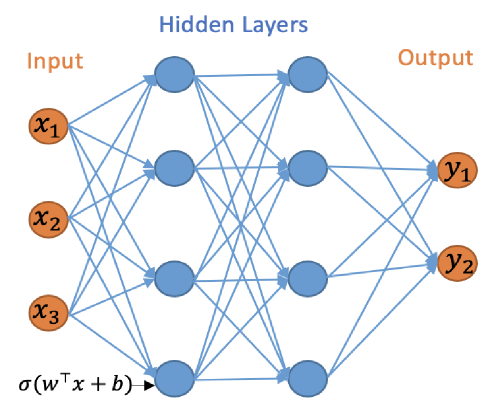
This image depicts a feedforward neural network with an input layer, two hidden layers, and an output layer. It illustrates the flow of information through the network, with connections between neurons in adjacent layers.
### Components/Axes
* **Input Layer:** Represented by three orange circles labeled $x_1$, $x_2$, and $x_3$. These are the input features to the network.
* **Hidden Layers:** Two layers of blue circles, each containing three neurons. These layers process the input data. The label "Hidden Layers" is positioned above these layers.
* **Output Layer:** Represented by two orange circles labeled $y_1$ and $y_2$. These are the final outputs of the network. The label "Output" is positioned to the right of this layer.
* **Connections:** Blue lines with arrows indicate the direction of information flow from one layer to the next. Every neuron in a layer is connected to every neuron in the subsequent layer.
* **Activation Function Notation:** A single arrow points to the bottom neuron of the first hidden layer, accompanied by the mathematical notation $\sigma(w^T x + b)$. This indicates that the output of each neuron is the result of applying an activation function (represented by $\sigma$) to a weighted sum of inputs ($w^T x$) plus a bias ($b$).
### Detailed Analysis or Content Details
* **Input Layer:** Consists of 3 input nodes ($x_1, x_2, x_3$).
* **First Hidden Layer:** Consists of 3 neurons. Each of the 3 input nodes is connected to each of these 3 neurons.
* **Second Hidden Layer:** Consists of 3 neurons. Each of the 3 neurons in the first hidden layer is connected to each of these 3 neurons.
* **Output Layer:** Consists of 2 output nodes ($y_1, y_2$). Each of the 3 neurons in the second hidden layer is connected to each of these 2 output nodes.
* **Activation Function:** The diagram explicitly shows the application of an activation function $\sigma(w^T x + b)$ to the weighted sum of inputs and bias for at least one neuron, implying this process occurs for all neurons in the hidden layers.
### Key Observations
* The network is fully connected between adjacent layers.
* There are 3 input features, 2 hidden layers with 3 neurons each, and 2 output predictions.
* The diagram visually represents a multi-layer perceptron (MLP) architecture.
### Interpretation
This diagram illustrates a fundamental structure of a deep learning model, specifically a feedforward neural network. The input layer receives raw data ($x_1, x_2, x_3$). This data is then processed through two sequential hidden layers, where complex patterns and features are extracted and transformed. The connections between neurons, weighted by parameters ($w$) and influenced by biases ($b$), along with the non-linear activation functions ($\sigma$), allow the network to learn intricate relationships within the data. Finally, the output layer produces the desired predictions ($y_1, y_2$) based on the processed information from the hidden layers. The notation $\sigma(w^T x + b)$ highlights the core computational step within each neuron: a linear transformation followed by a non-linear activation, which is crucial for the network's ability to model non-linear phenomena. This architecture is commonly used for tasks such as classification and regression.