\n
## Diagram: Neural Network Architecture
### Overview
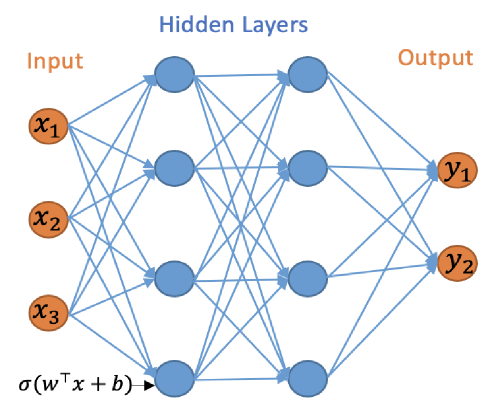
The image depicts a schematic diagram of a feedforward neural network. It illustrates the basic structure of an artificial neural network with an input layer, one or more hidden layers, and an output layer. The connections between nodes (neurons) are represented by lines, indicating the flow of information.
### Components/Axes
The diagram is divided into three main sections, labeled from left to right: "Input", "Hidden Layers", and "Output".
* **Input Layer:** Contains three nodes labeled x₁, x₂, and x₃. These nodes are represented by orange circles.
* **Hidden Layers:** Consists of two layers of nodes. The first hidden layer has four nodes, and the second hidden layer has two nodes. These nodes are represented by blue circles.
* **Output Layer:** Contains two nodes labeled y₁ and y₂. These nodes are represented by orange circles.
* **Connections:** Blue lines connect nodes between layers, representing weighted connections.
* **Activation Function:** The equation "σ(wᵀx + b)" is present at the bottom-left, likely representing an activation function applied to the weighted sum of inputs.
### Detailed Analysis or Content Details
The diagram shows a fully connected network, meaning each node in one layer is connected to every node in the next layer.
* **Input Layer:**
* x₁ is the first input feature.
* x₂ is the second input feature.
* x₃ is the third input feature.
* **Hidden Layers:**
* The first hidden layer receives input from all three input nodes (x₁, x₂, x₃).
* The second hidden layer receives input from all four nodes in the first hidden layer.
* **Output Layer:**
* y₁ is the first output.
* y₂ is the second output.
* The output layer receives input from all two nodes in the second hidden layer.
* **Activation Function:**
* σ represents the sigmoid function or another activation function.
* wᵀ represents the transpose of the weight matrix.
* x represents the input vector.
* b represents the bias vector.
### Key Observations
The network has a relatively simple architecture with only three input nodes and two output nodes. The presence of the activation function suggests that the network is capable of learning non-linear relationships between the inputs and outputs. The diagram does not provide any specific values for weights, biases, or activation function parameters.
### Interpretation
This diagram illustrates the fundamental structure of a neural network used for machine learning tasks. The network takes three input features (x₁, x₂, x₃), processes them through two hidden layers, and produces two outputs (y₁, y₂). The connections between nodes represent the weights that are learned during the training process. The activation function introduces non-linearity, allowing the network to model complex relationships. The diagram is a conceptual representation and does not provide any information about the specific application or performance of the network. It serves as a visual aid for understanding the basic principles of neural network architecture. The equation at the bottom suggests that the network uses a weighted sum of inputs, combined with a bias, and then passed through an activation function to produce the output of each neuron. This is a standard approach in many neural network models.