TECHNICAL ASSET FINGERPRINT
08cbd06de6c85b2943908258
Click to view fullscreen
Press ESC or click to close
FOUND IN PAPERS
EXPERT: gemini-2.5-flash-lite-free VERSION 1
RUNTIME: google-free/gemini-2.5-flash-lite
INTEL_VERIFIED
## Heatmap: Token Attribution Analysis
### Overview
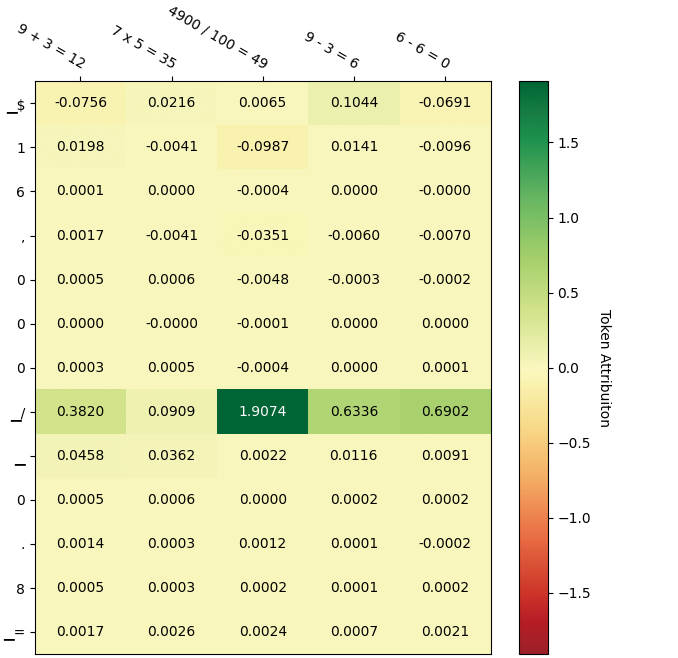
This image is a heatmap visualizing token attribution scores. The heatmap displays a matrix of numerical values, colored according to a gradient scale that represents "Token Attribution". The rows and columns are labeled with characters and mathematical expressions, respectively. The color intensity indicates the magnitude and sign of the attribution score, with dark green representing high positive attribution, yellow representing near-zero attribution, and dark red representing high negative attribution.
### Components/Axes
**X-axis (Column Headers):**
The x-axis labels are mathematical expressions:
* `9 + 3 = 12`
* `7 x 5 = 35`
* `4900 / 100 = 49`
* `9 - 3 = 6`
* `6 - 6 = 0`
**Y-axis (Row Headers):**
The y-axis labels are single characters or symbols:
* `-$`
* `1`
* `6`
* `,`
* `0`
* `0`
* `0`
* `_/`
* `-`
* `0`
* `.`
* `8`
* `=`
**Colorbar (Legend):**
* **Title:** `Token Attributon` (Note: "Attributon" appears to be a typo and should likely be "Attribution").
* **Scale:** The colorbar ranges from approximately -1.5 (dark red) to 1.5 (dark green), with 0.0 indicated by a light yellow/beige color. Intermediate values are represented by shades of red, orange, yellow, light green, and dark green.
### Detailed Analysis or Content Details
The heatmap contains numerical values for each cell, representing the token attribution score for the intersection of a given row token and column expression.
**Row `-$`:**
* `9 + 3 = 12`: -0.0756 (light red/orange)
* `7 x 5 = 35`: 0.0216 (light yellow)
* `4900 / 100 = 49`: 0.0065 (light yellow)
* `9 - 3 = 6`: 0.1044 (light green)
* `6 - 6 = 0`: -0.0691 (light red/orange)
**Row `1`:**
* `9 + 3 = 12`: 0.0198 (light yellow)
* `7 x 5 = 35`: -0.0041 (light yellow)
* `4900 / 100 = 49`: -0.0987 (light red/orange)
* `9 - 3 = 6`: 0.0141 (light yellow)
* `6 - 6 = 0`: -0.0096 (light yellow)
**Row `6`:**
* `9 + 3 = 12`: 0.0001 (very light yellow)
* `7 x 5 = 35`: 0.0000 (very light yellow)
* `4900 / 100 = 49`: -0.0004 (very light yellow)
* `9 - 3 = 6`: 0.0000 (very light yellow)
* `6 - 6 = 0`: -0.0000 (very light yellow)
**Row `,`:**
* `9 + 3 = 12`: 0.0017 (light yellow)
* `7 x 5 = 35`: -0.0041 (light yellow)
* `4900 / 100 = 49`: -0.0351 (light yellow)
* `9 - 3 = 6`: -0.0060 (light yellow)
* `6 - 6 = 0`: -0.0070 (light yellow)
**Row `0` (first instance):**
* `9 + 3 = 12`: 0.0005 (light yellow)
* `7 x 5 = 35`: 0.0006 (light yellow)
* `4900 / 100 = 49`: -0.0048 (light yellow)
* `9 - 3 = 6`: -0.0003 (light yellow)
* `6 - 6 = 0`: -0.0002 (light yellow)
**Row `0` (second instance):**
* `9 + 3 = 12`: 0.0000 (very light yellow)
* `7 x 5 = 35`: -0.0000 (very light yellow)
* `4900 / 100 = 49`: -0.0001 (very light yellow)
* `9 - 3 = 6`: 0.0000 (very light yellow)
* `6 - 6 = 0`: 0.0000 (very light yellow)
**Row `0` (third instance):**
* `9 + 3 = 12`: 0.0003 (light yellow)
* `7 x 5 = 35`: 0.0005 (light yellow)
* `4900 / 100 = 49`: -0.0004 (light yellow)
* `9 - 3 = 6`: 0.0000 (light yellow)
* `6 - 6 = 0`: 0.0001 (light yellow)
**Row `_/`:**
* `9 + 3 = 12`: 0.3820 (medium green)
* `7 x 5 = 35`: 0.0909 (light green)
* `4900 / 100 = 49`: 1.9074 (darkest green, highest value)
* `9 - 3 = 6`: 0.6336 (green)
* `6 - 6 = 0`: 0.6902 (green)
**Row `-`:**
* `9 + 3 = 12`: 0.0458 (light yellow/green)
* `7 x 5 = 35`: 0.0362 (light yellow/green)
* `4900 / 100 = 49`: 0.0022 (light yellow)
* `9 - 3 = 6`: 0.0116 (light yellow)
* `6 - 6 = 0`: 0.0091 (light yellow)
**Row `0` (fourth instance):**
* `9 + 3 = 12`: 0.0005 (light yellow)
* `7 x 5 = 35`: 0.0006 (light yellow)
* `4900 / 100 = 49`: 0.0000 (very light yellow)
* `9 - 3 = 6`: 0.0002 (light yellow)
* `6 - 6 = 0`: 0.0002 (light yellow)
**Row `.`:**
* `9 + 3 = 12`: 0.0014 (light yellow)
* `7 x 5 = 35`: 0.0003 (light yellow)
* `4900 / 100 = 49`: 0.0012 (light yellow)
* `9 - 3 = 6`: 0.0001 (very light yellow)
* `6 - 6 = 0`: -0.0002 (very light yellow)
**Row `8`:**
* `9 + 3 = 12`: 0.0005 (light yellow)
* `7 x 5 = 35`: 0.0003 (light yellow)
* `4900 / 100 = 49`: 0.0002 (light yellow)
* `9 - 3 = 6`: 0.0001 (very light yellow)
* `6 - 6 = 0`: 0.0002 (light yellow)
**Row `=`:**
* `9 + 3 = 12`: 0.0017 (light yellow)
* `7 x 5 = 35`: 0.0026 (light yellow)
* `4900 / 100 = 49`: 0.0024 (light yellow)
* `9 - 3 = 6`: 0.0007 (light yellow)
* `6 - 6 = 0`: 0.0021 (light yellow)
### Key Observations
* **Dominant Attribution:** The row labeled `_/` exhibits significantly higher positive token attribution scores across all column expressions compared to other rows. The highest score, 1.9074, is observed at the intersection of `_/` and `4900 / 100 = 49`.
* **Low Attribution:** Most cells in the heatmap show very low attribution scores, close to zero, indicated by light yellow and very light yellow colors. This suggests that for most row tokens and column expressions, the attribution is minimal.
* **Negative Attribution:** Some cells, particularly in the `-$` and `1` rows, show slightly negative attribution scores (e.g., -0.0756, -0.0987), indicated by light red/orange colors.
* **Expression `4900 / 100 = 49`:** This expression, when paired with the `_/` token, shows the most pronounced positive attribution.
* **Expression `9 + 3 = 12`:** This expression, when paired with the `_/` token, also shows a substantial positive attribution (0.3820).
* **Repetitive Row Labels:** The label '0' appears multiple times on the y-axis. The attribution scores for these rows are generally very low and close to zero.
### Interpretation
This heatmap likely represents the output of a model, possibly a natural language processing model, where token attribution is used to understand which input tokens (represented by the row labels) contribute most to the model's prediction or understanding of specific expressions (represented by the column labels).
* **High Attribution for `_/`:** The significantly high positive attribution scores for the `_/` token across various mathematical expressions suggest that this token plays a crucial role in the model's processing of these expressions. It might represent a critical component or a special token that the model heavily relies on when evaluating mathematical operations. The peak attribution for `4900 / 100 = 49` indicates a particularly strong association.
* **Low Attribution for Most Tokens:** The near-zero attribution for most other tokens suggests that they are either less important for understanding these specific mathematical expressions or that their contributions are balanced out (positive and negative contributions cancel each other out).
* **Negative Attribution:** The slightly negative attributions might indicate tokens that, in certain contexts, detract from or oppose the model's understanding of an expression.
* **Contextual Importance:** The varying attribution scores across different expressions for the same token (e.g., `_/`) highlight the contextual importance of tokens. The model's reliance on `_/` is not uniform but is amplified by specific expressions.
* **Potential for Anomaly Detection or Feature Importance:** This type of visualization is useful for identifying which input features (tokens) are most influential for specific outputs (expressions). It could be used to debug models, understand their decision-making process, or identify key features in a dataset. The strong attribution to `_/` might point to a specific linguistic or structural element that the model has learned to associate with mathematical correctness or evaluation.
DECODING INTELLIGENCE...