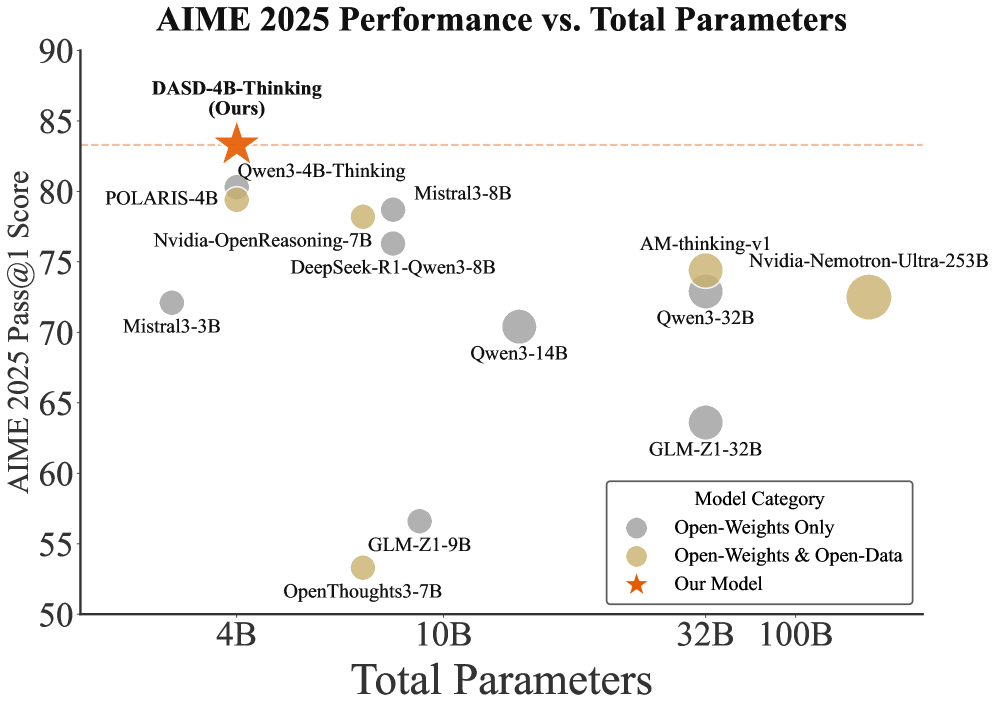
## Scatter Plot: AIME 2025 Performance vs. Total Parameters
### Overview
This scatter plot visualizes the relationship between the AIME 2025 Pass@1 Score and the Total Parameters of various language models. The plot displays model performance on the y-axis (AIME 2025 Pass@1 Score) against model size on the x-axis (Total Parameters). Models are color-coded based on their category (Open-Weights Only, Open-Weights & Open-Data, and Our Model).
### Components/Axes
* **Title:** AIME 2025 Performance vs. Total Parameters
* **X-axis:** Total Parameters (Scale: 4B, 10B, 32B, 100B)
* **Y-axis:** AIME 2025 Pass@1 Score (Scale: 50, 60, 70, 80, 90)
* **Legend:**
* Gray Circle: Open-Weights Only
* Yellow Circle: Open-Weights & Open-Data
* Red Star: Our Model
* **Data Points:** Represent individual language models, positioned according to their AIME 2025 Pass@1 Score and Total Parameters.
### Detailed Analysis
The data points are scattered across the plot, showing a general trend of increasing performance with increasing parameters, but with significant variation.
Here's a breakdown of the data points, reading from left to right (increasing parameter count):
* **4B:**
* POLARIS-4B: Approximately (4B, 81). Gray circle.
* Mistral3-3B: Approximately (4B, 71). Yellow circle.
* **10B:**
* Nvidia-OpenReasoning-7B: Approximately (10B, 76). Yellow circle.
* DeepSeek-R1-Qwen3-8B: Approximately (10B, 74). Yellow circle.
* Mistral3-8B: Approximately (10B, 80). Yellow circle.
* Qwen3-4B-Thinking: Approximately (10B, 80). Gray circle.
* GLM-ZI-9B: Approximately (10B, 56). Yellow circle.
* **32B:**
* Qwen3-14B: Approximately (32B, 70). Yellow circle.
* Qwen3-32B: Approximately (32B, 73). Yellow circle.
* GLM-ZI-32B: Approximately (32B, 60). Yellow circle.
* **100B:**
* AM-thinking-v1: Approximately (100B, 74). Yellow circle.
* Nvidia-Nemotron-Ultra-253B: Approximately (100B, 72). Yellow circle.
* **Our Model:**
* DASD-4B-Thinking (Ours): Approximately (4B, 84). Red star.
* OpenThoughts3-7B: Approximately (10B, 52). Yellow circle.
The trend for the yellow circles (Open-Weights & Open-Data) is generally upward, but with considerable spread. The gray circles (Open-Weights Only) are clustered around the 80 score mark. Our model (red star) shows a high score at a relatively small parameter size.
### Key Observations
* **Outlier:** DASD-4B-Thinking (Our Model) significantly outperforms other models with a similar parameter count (4B).
* **Parameter Scaling:** There's a positive correlation between parameters and performance, but the relationship isn't strictly linear. Some models with fewer parameters perform comparably to those with more.
* **Model Category Variation:** The Open-Weights & Open-Data models (yellow) exhibit the widest range of performance.
* **Clustering:** Models in the 4B and 10B range show a tighter clustering of performance scores.
### Interpretation
The data suggests that model size (Total Parameters) is a significant factor in achieving high AIME 2025 Pass@1 Scores, but it is not the sole determinant. The category of the model (Open-Weights Only vs. Open-Weights & Open-Data) also plays a role, with the latter exhibiting more variability. The outlier performance of "DASD-4B-Thinking (Ours)" indicates that architectural innovations or training methodologies can lead to substantial gains in performance even with limited parameters.
The spread of data points highlights the importance of factors beyond model size, such as training data quality, model architecture, and optimization techniques. The plot provides a comparative snapshot of the current landscape of language models, demonstrating the trade-offs between model size, performance, and accessibility (as indicated by the Open-Weights/Open-Data categorization). The data suggests that focusing solely on increasing parameters may not be the most effective strategy for improving performance; rather, a holistic approach that considers all aspects of model development is crucial.