## Scatter Plot: AIME 2025 Performance vs. Total Parameters
### Overview
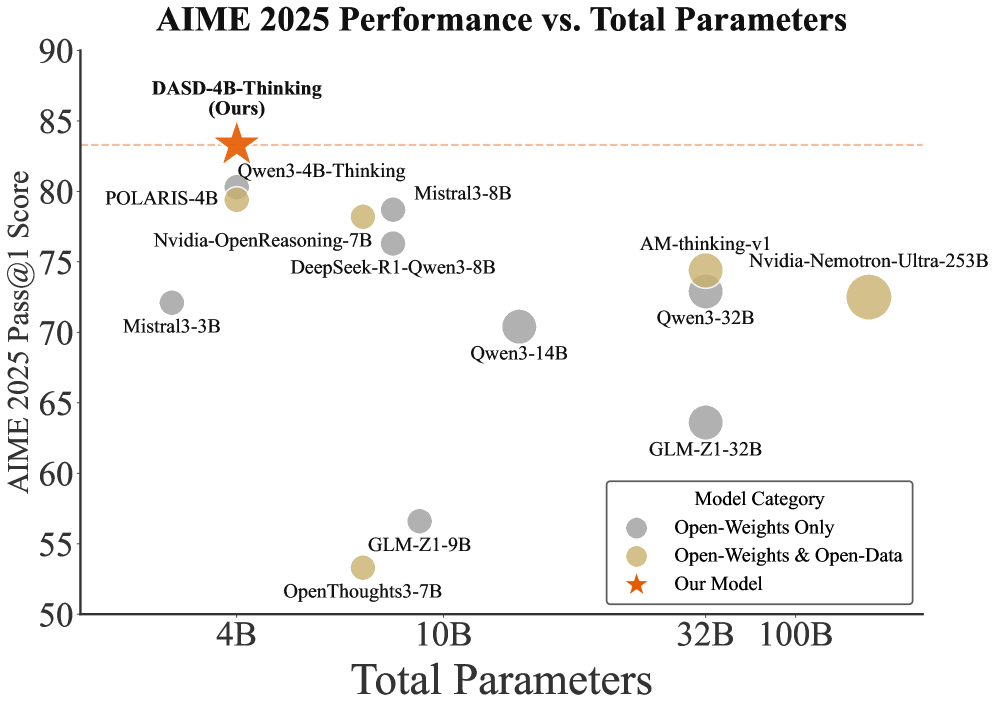
This is a scatter plot comparing the performance of various AI models on the AIME 2025 benchmark against their total parameter count. The chart highlights a specific model, "DASD-4B-Thinking (Ours)," and compares it against other models categorized by their weight and data openness.
### Components/Axes
* **Chart Title:** "AIME 2025 Performance vs. Total Parameters"
* **Y-Axis:** "AIME 2025 Pass@1 Score". The scale runs from 50 to 90, with major tick marks every 5 units (50, 55, 60, 65, 70, 75, 80, 85, 90).
* **X-Axis:** "Total Parameters". The scale is logarithmic, with labeled tick marks at 4B, 10B, 32B, and 100B (where B likely denotes billion).
* **Legend:** Located in the bottom-right quadrant. It defines three model categories:
* **Gray Circle:** "Open-Weights Only"
* **Tan/Gold Circle:** "Open-Weights & Open-Data"
* **Orange Star:** "Our Model"
* **Reference Line:** A horizontal, dashed orange line extends from the "Our Model" data point across the chart at a score of approximately 83.5.
### Detailed Analysis
The plot contains 13 distinct data points. Below is a list of each model, its approximate parameter count (x-axis), its approximate AIME score (y-axis), and its category based on the legend.
**Models with ~4B Parameters:**
1. **DASD-4B-Thinking (Ours):** ~4B parameters, Score: ~83.5. (Orange Star - "Our Model"). This is the highest-performing model on the chart.
2. **POLARIS-4B:** ~4B parameters, Score: ~79. (Tan Circle - "Open-Weights & Open-Data").
3. **Mistral3-3B:** ~3B parameters, Score: ~72. (Gray Circle - "Open-Weights Only").
**Models with ~7B-8B Parameters:**
4. **Qwen3-4B-Thinking:** ~7B parameters, Score: ~79. (Gray Circle - "Open-Weights Only").
5. **Nvidia-OpenReasoning-7B:** ~7B parameters, Score: ~77. (Gray Circle - "Open-Weights Only").
6. **Mistral3-8B:** ~8B parameters, Score: ~78. (Gray Circle - "Open-Weights Only").
7. **DeepSeek-R1-Qwen3-8B:** ~8B parameters, Score: ~76. (Gray Circle - "Open-Weights Only").
8. **OpenThoughts3-7B:** ~7B parameters, Score: ~53. (Tan Circle - "Open-Weights & Open-Data"). This is a notable low-performer for its size.
9. **GLM-Z1-9B:** ~9B parameters, Score: ~56. (Gray Circle - "Open-Weights Only").
**Models with ~14B-32B Parameters:**
10. **Qwen3-14B:** ~14B parameters, Score: ~70. (Gray Circle - "Open-Weights Only").
11. **GLM-Z1-32B:** ~32B parameters, Score: ~63. (Gray Circle - "Open-Weights Only").
12. **Qwen3-32B:** ~32B parameters, Score: ~72. (Gray Circle - "Open-Weights Only").
13. **AM-thinking-v1:** ~32B parameters, Score: ~74. (Tan Circle - "Open-Weights & Open-Data").
**Model with ~253B Parameters:**
14. **Nvidia-Nemotron-Ultra-253B:** ~253B parameters, Score: ~72. (Tan Circle - "Open-Weights & Open-Data").
### Key Observations
1. **Performance Outlier:** The "Our Model" (DASD-4B-Thinking) significantly outperforms all other models, achieving the highest score (~83.5) with a relatively small parameter count (~4B).
2. **Efficiency Trend:** There is no clear positive correlation between parameter count and performance. Several smaller models (e.g., POLARIS-4B, Qwen3-4B-Thinking) outperform much larger models (e.g., Nvidia-Nemotron-Ultra-253B, Qwen3-32B).
3. **Low-Performing Cluster:** Two models, OpenThoughts3-7B and GLM-Z1-9B, form a distinct low-scoring cluster with scores in the 50s, despite having parameter counts similar to mid-performing 7B-8B models.
4. **Category Distribution:** "Open-Weights Only" models (gray) are the most numerous and show the widest performance variance (scores from ~56 to ~79). "Open-Weights & Open-Data" models (tan) are fewer but include both high performers (POLARIS-4B) and the largest model on the chart.
### Interpretation
The data suggests that model architecture, training methodology, or data quality (factors not directly shown) are more critical to achieving high AIME 2025 scores than sheer model size. The standout performance of "DASD-4B-Thinking" implies a significant efficiency breakthrough, achieving state-of-the-art results with a compact model. The chart effectively argues that bigger is not always better in this benchmark context. The presence of low-scoring models in the 7B-9B range indicates that this parameter size is a competitive but volatile space where implementation details lead to drastically different outcomes. The horizontal reference line from the "Our Model" point serves as a visual benchmark, emphasizing the performance gap it has established over both smaller and substantially larger competitors.