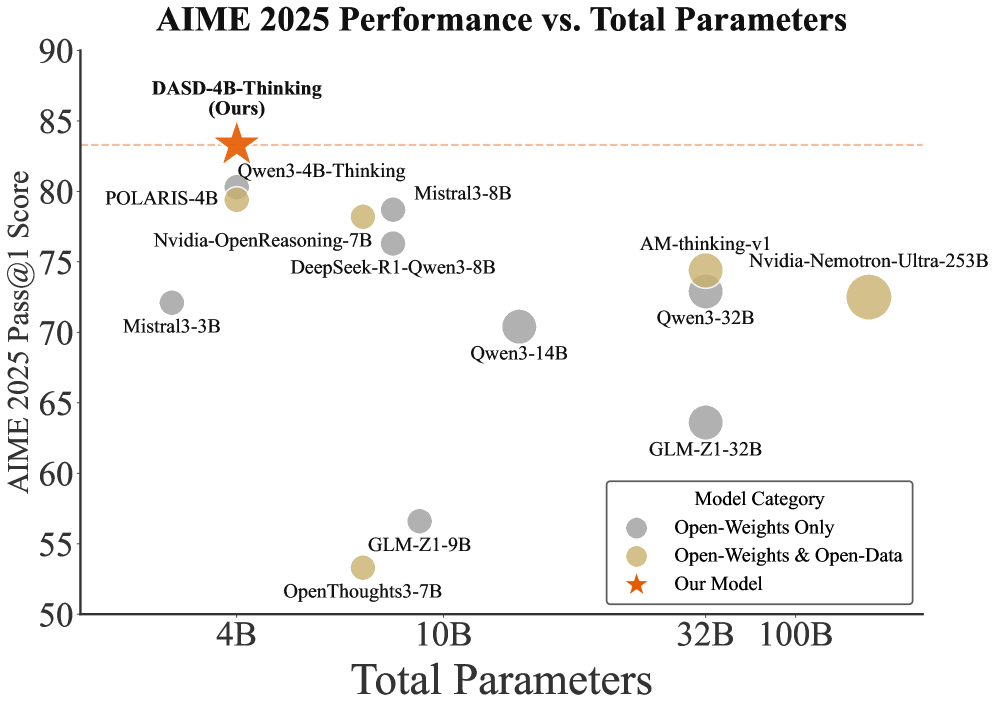
## Scatter Plot: AIME 2025 Performance vs. Total Parameters
### Overview
The image is a scatter plot comparing the performance of various AI models on the AIME 2025 benchmark against their total parameter counts. The y-axis represents the "AIME 2025 Pass@1 Score" (ranging from 50 to 90), while the x-axis shows "Total Parameters" (from 4B to 100B). Data points are color-coded by model category: gray for "Open-Weights Only," beige for "Open-Weights & Open-Data," and orange for "Our Model." A red dashed line at ~85 marks a performance threshold.
### Components/Axes
- **Title**: "AIME 2025 Performance vs. Total Parameters" (top center).
- **X-axis**: "Total Parameters" (logarithmic scale: 4B, 10B, 32B, 100B).
- **Y-axis**: "AIME 2025 Pass@1 Score" (linear scale: 50–90).
- **Legend**: Bottom-right corner, with three categories:
- Gray: Open-Weights Only
- Beige: Open-Weights & Open-Data
- Orange Star: Our Model
- **Data Points**: Labeled with model names and parameter counts (e.g., "DASD-4B-Thinking (Ours)").
### Detailed Analysis
- **Model Categories**:
- **Open-Weights Only (Gray)**:
- POLARIS-4B (4B parameters, ~80 score)
- Mistral3-3B (4B, ~72)
- Nvidia-OpenReasoning-7B (7B, ~75)
- DeepSeek-R1-Qwen3-8B (8B, ~75)
- Qwen3-14B (14B, ~70)
- GLM-Z1-32B (32B, ~65)
- OpenThoughts3-7B (7B, ~55)
- GLM-Z1-9B (9B, ~55)
- **Open-Weights & Open-Data (Beige)**:
- Qwen3-4B-Thinking (4B, ~80)
- Mistral3-8B (8B, ~78)
- Qwen3-32B (32B, ~74)
- Nvidia-Nemotron-Ultra-253B (253B, ~73)
- AM-thinking-v1 (32B, ~74)
- **Our Model (Orange Star)**:
- DASD-4B-Thinking (4B, ~85).
- **Trends**:
- **Performance vs. Parameters**: Larger models generally achieve higher scores, but exceptions exist (e.g., Qwen3-14B at 14B parameters scores lower than Mistral3-8B at 8B).
- **Category Performance**: "Open-Weights & Open-Data" models (beige) dominate the upper-right quadrant, while "Open-Weights Only" (gray) are more spread out. "Our Model" (DASD-4B-Thinking) achieves the highest score despite having the fewest parameters.
### Key Observations
1. **Outlier**: DASD-4B-Thinking (orange star) outperforms all other models, including larger ones, suggesting efficiency or architectural advantages.
2. **Threshold**: The red dashed line at ~85 indicates a performance benchmark; only DASD-4B-Thinking and Qwen3-4B-Thinking exceed it.
3. **Parameter Efficiency**: Some smaller models (e.g., POLARIS-4B, Qwen3-4B-Thinking) achieve scores comparable to larger models (e.g., Qwen3-32B, Nvidia-Nemotron-Ultra-253B).
### Interpretation
The data highlights a trade-off between model size and performance. While larger models (e.g., 253B parameters) generally perform better, the "Our Model" (DASD-4B-Thinking) demonstrates that optimized architectures or training strategies can achieve superior results with fewer parameters. The dominance of "Open-Weights & Open-Data" models in the high-performance quadrant suggests that open-data integration may enhance performance. However, the variability in scores across similar parameter ranges (e.g., 8B vs. 14B) indicates that factors beyond parameter count—such as training data quality, model architecture, or fine-tuning—play critical roles in benchmark performance.