## Bar Chart: Prediction Flip Rate Comparison for Mistral-7B Models
### Overview
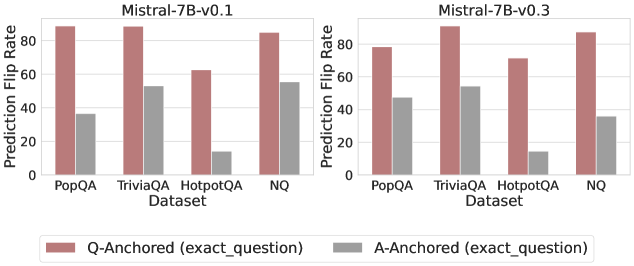
The image presents two bar charts comparing the prediction flip rates of Mistral-7B models (v0.1 and v0.3) across different datasets. The charts compare "Q-Anchored" (exact question) and "A-Anchored" (exact question) methods.
### Components/Axes
* **Titles:**
* Left Chart: "Mistral-7B-v0.1"
* Right Chart: "Mistral-7B-v0.3"
* **Y-Axis:** "Prediction Flip Rate" with a scale from 0 to 80 in increments of 20.
* **X-Axis:** "Dataset" with categories: PopQA, TriviaQA, HotpotQA, NQ.
* **Legend:** Located at the bottom of the image.
* Rose/Pink: "Q-Anchored (exact\_question)"
* Gray: "A-Anchored (exact\_question)"
### Detailed Analysis
**Left Chart (Mistral-7B-v0.1):**
* **PopQA:**
* Q-Anchored: Approximately 86%
* A-Anchored: Approximately 36%
* **TriviaQA:**
* Q-Anchored: Approximately 87%
* A-Anchored: Approximately 53%
* **HotpotQA:**
* Q-Anchored: Approximately 63%
* A-Anchored: Approximately 13%
* **NQ:**
* Q-Anchored: Approximately 83%
* A-Anchored: Approximately 55%
**Right Chart (Mistral-7B-v0.3):**
* **PopQA:**
* Q-Anchored: Approximately 78%
* A-Anchored: Approximately 47%
* **TriviaQA:**
* Q-Anchored: Approximately 88%
* A-Anchored: Approximately 53%
* **HotpotQA:**
* Q-Anchored: Approximately 72%
* A-Anchored: Approximately 13%
* **NQ:**
* Q-Anchored: Approximately 85%
* A-Anchored: Approximately 35%
### Key Observations
* For both model versions, the "Q-Anchored" method consistently shows a higher prediction flip rate than the "A-Anchored" method across all datasets.
* The "HotpotQA" dataset exhibits the lowest "A-Anchored" prediction flip rate for both model versions.
* The "TriviaQA" dataset exhibits the highest "Q-Anchored" prediction flip rate for the v0.3 model.
* The "Q-Anchored" prediction flip rate is relatively consistent across all datasets for both model versions, with the exception of "HotpotQA" in v0.1.
* The "A-Anchored" prediction flip rate varies more significantly across datasets compared to the "Q-Anchored" method.
### Interpretation
The data suggests that anchoring the question directly ("Q-Anchored") leads to a higher prediction flip rate compared to anchoring the answer ("A-Anchored") for both Mistral-7B model versions. This could indicate that the model is more sensitive to changes in the question phrasing than the answer phrasing. The lower "A-Anchored" flip rate for "HotpotQA" might be due to the complexity of the questions in that dataset, making the model less susceptible to changes in the answer phrasing. The difference between v0.1 and v0.3 is subtle, but there are some changes in the prediction flip rates across the datasets. For example, the "Q-Anchored" rate for "PopQA" is lower in v0.3 compared to v0.1, while the "Q-Anchored" rate for "HotpotQA" is higher in v0.3 compared to v0.1. These changes could be due to improvements in the model's ability to handle different types of questions.