\n
## Bar Chart: Prediction Flip Rate Comparison
### Overview
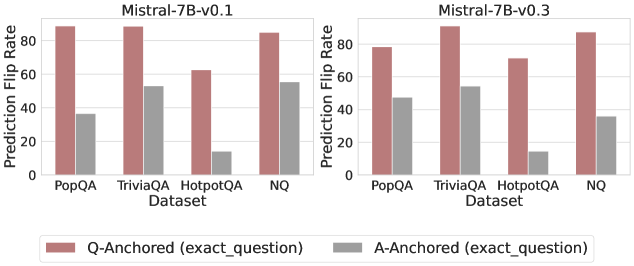
This image presents a bar chart comparing the Prediction Flip Rate for two models, Mistral-7B-v0.1 and Mistral-7B-v0.3, across four datasets: PopQA, TriviaQA, HotpotQA, and NQ. The chart uses paired bars to represent two anchoring methods: Q-Anchored (exact_question) and A-Anchored (exact_question).
### Components/Axes
* **X-axis:** Dataset - PopQA, TriviaQA, HotpotQA, NQ.
* **Y-axis:** Prediction Flip Rate - Scale ranges from 0 to 80 (approximately).
* **Models:** Mistral-7B-v0.1 (left chart), Mistral-7B-v0.3 (right chart).
* **Legend:**
* Red: Q-Anchored (exact\_question)
* Gray: A-Anchored (exact\_question)
### Detailed Analysis
**Mistral-7B-v0.1 (Left Chart)**
* **PopQA:** Q-Anchored: ~68, A-Anchored: ~42
* **TriviaQA:** Q-Anchored: ~72, A-Anchored: ~52
* **HotpotQA:** Q-Anchored: ~56, A-Anchored: ~16
* **NQ:** Q-Anchored: ~64, A-Anchored: ~32
The Q-Anchored bars consistently show higher flip rates than the A-Anchored bars across all datasets. The highest flip rate for this model is observed on the TriviaQA dataset with Q-Anchoring. The lowest flip rate is observed on the HotpotQA dataset with A-Anchoring.
**Mistral-7B-v0.3 (Right Chart)**
* **PopQA:** Q-Anchored: ~60, A-Anchored: ~44
* **TriviaQA:** Q-Anchored: ~76, A-Anchored: ~52
* **HotpotQA:** Q-Anchored: ~60, A-Anchored: ~24
* **NQ:** Q-Anchored: ~68, A-Anchored: ~36
Similar to the v0.1 model, Q-Anchored consistently outperforms A-Anchored in flip rate. The highest flip rate for this model is observed on the TriviaQA dataset with Q-Anchoring. The lowest flip rate is observed on the HotpotQA dataset with A-Anchoring.
### Key Observations
* Q-Anchoring consistently results in higher prediction flip rates than A-Anchoring for both models across all datasets.
* TriviaQA consistently shows the highest flip rates for both models and both anchoring methods.
* HotpotQA consistently shows the lowest flip rates for both models and both anchoring methods.
* The difference in flip rate between Q-Anchored and A-Anchored is more pronounced for the HotpotQA dataset.
* The flip rates for Mistral-7B-v0.3 are generally higher than those for Mistral-7B-v0.1, particularly for Q-Anchoring.
### Interpretation
The data suggests that anchoring predictions using the exact question (Q-Anchored) leads to a higher rate of prediction flips compared to anchoring with the exact answer (A-Anchored). This could indicate that the question provides more informative cues for identifying potential errors in the model's predictions. The consistently high flip rates on TriviaQA might suggest that this dataset presents more challenging or ambiguous questions, while HotpotQA might contain more straightforward or well-defined questions. The improvement in flip rates from v0.1 to v0.3 suggests that the model updates have improved the model's ability to identify and correct its own predictions, or that the model is more sensitive to the anchoring method. The difference in flip rates between anchoring methods could be used as a metric for evaluating the robustness of the model's predictions.