## Bar Chart: Prediction Flip Rate Comparison for Mistral-7B Models
### Overview
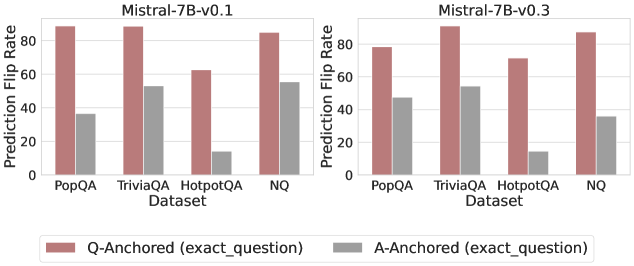
The image presents a comparative bar chart analyzing prediction flip rates for two versions of the Mistral-7B language model (v0.1 and v0.3) across four question-answering datasets: PopQA, TriviaQA, HotpotQA, and NQ. The chart contrasts two anchoring strategies: Q-Anchored (exact_question) and A-Anchored (exact_question), visualized through red and gray bars respectively.
### Components/Axes
- **X-Axis (Datasets)**: PopQA, TriviaQA, HotpotQA, NQ (left to right)
- **Y-Axis (Prediction Flip Rate)**: Scaled from 0 to 100
- **Legend**:
- Red bars: Q-Anchored (exact_question)
- Gray bars: A-Anchored (exact_question)
- **Model Versions**:
- Left section: Mistral-7B-v0.1
- Right section: Mistral-7B-v0.3
### Detailed Analysis
#### Mistral-7B-v0.1
- **PopQA**:
- Q-Anchored: ~85
- A-Anchored: ~35
- **TriviaQA**:
- Q-Anchored: ~85
- A-Anchored: ~50
- **HotpotQA**:
- Q-Anchored: ~60
- A-Anchored: ~10
- **NQ**:
- Q-Anchored: ~85
- A-Anchored: ~55
#### Mistral-7B-v0.3
- **PopQA**:
- Q-Anchored: ~75
- A-Anchored: ~45
- **TriviaQA**:
- Q-Anchored: ~90
- A-Anchored: ~50
- **HotpotQA**:
- Q-Anchored: ~70
- A-Anchored: ~10
- **NQ**:
- Q-Anchored: ~85
- A-Anchored: ~35
### Key Observations
1. **Consistent Q-Anchored Superiority**: Q-Anchored (red) bars consistently outperform A-Anchored (gray) across all datasets and models, with differences ranging from 20-55 percentage points.
2. **Version-Specific Trends**:
- **TriviaQA**: v0.3 shows a 5% improvement in Q-Anchored performance (85→90) compared to v0.1.
- **HotpotQA**: v0.3 reduces Q-Anchored performance by 10 points (60→70) but maintains identical A-Anchored performance (10).
- **NQ**: v0.3 shows a 20-point drop in A-Anchored performance (55→35) while maintaining Q-Anchored stability.
3. **Dataset Variability**:
- HotpotQA exhibits the largest performance gap between anchoring strategies (~60 vs. ~10 in v0.1).
- NQ shows the smallest performance gap (~85 vs. ~55 in v0.1).
### Interpretation
The data demonstrates that Q-Anchored (exact_question) anchoring consistently yields higher prediction flip rates than A-Anchored (exact_question) across both model versions. The 5% improvement in TriviaQA performance in v0.3 suggests targeted enhancements in handling trivia-based questions. However, the 10-point drop in HotpotQA Q-Anchored performance in v0.3 raises questions about potential overfitting or dataset-specific limitations in the updated model. The significant drop in NQ A-Anchored performance (20 points) between versions indicates possible architectural changes affecting answer-based reasoning. These findings highlight the importance of anchoring strategy selection and model version compatibility when optimizing question-answering systems.