## Line Chart: Problem Solving Performance vs. Solution Count
### Overview
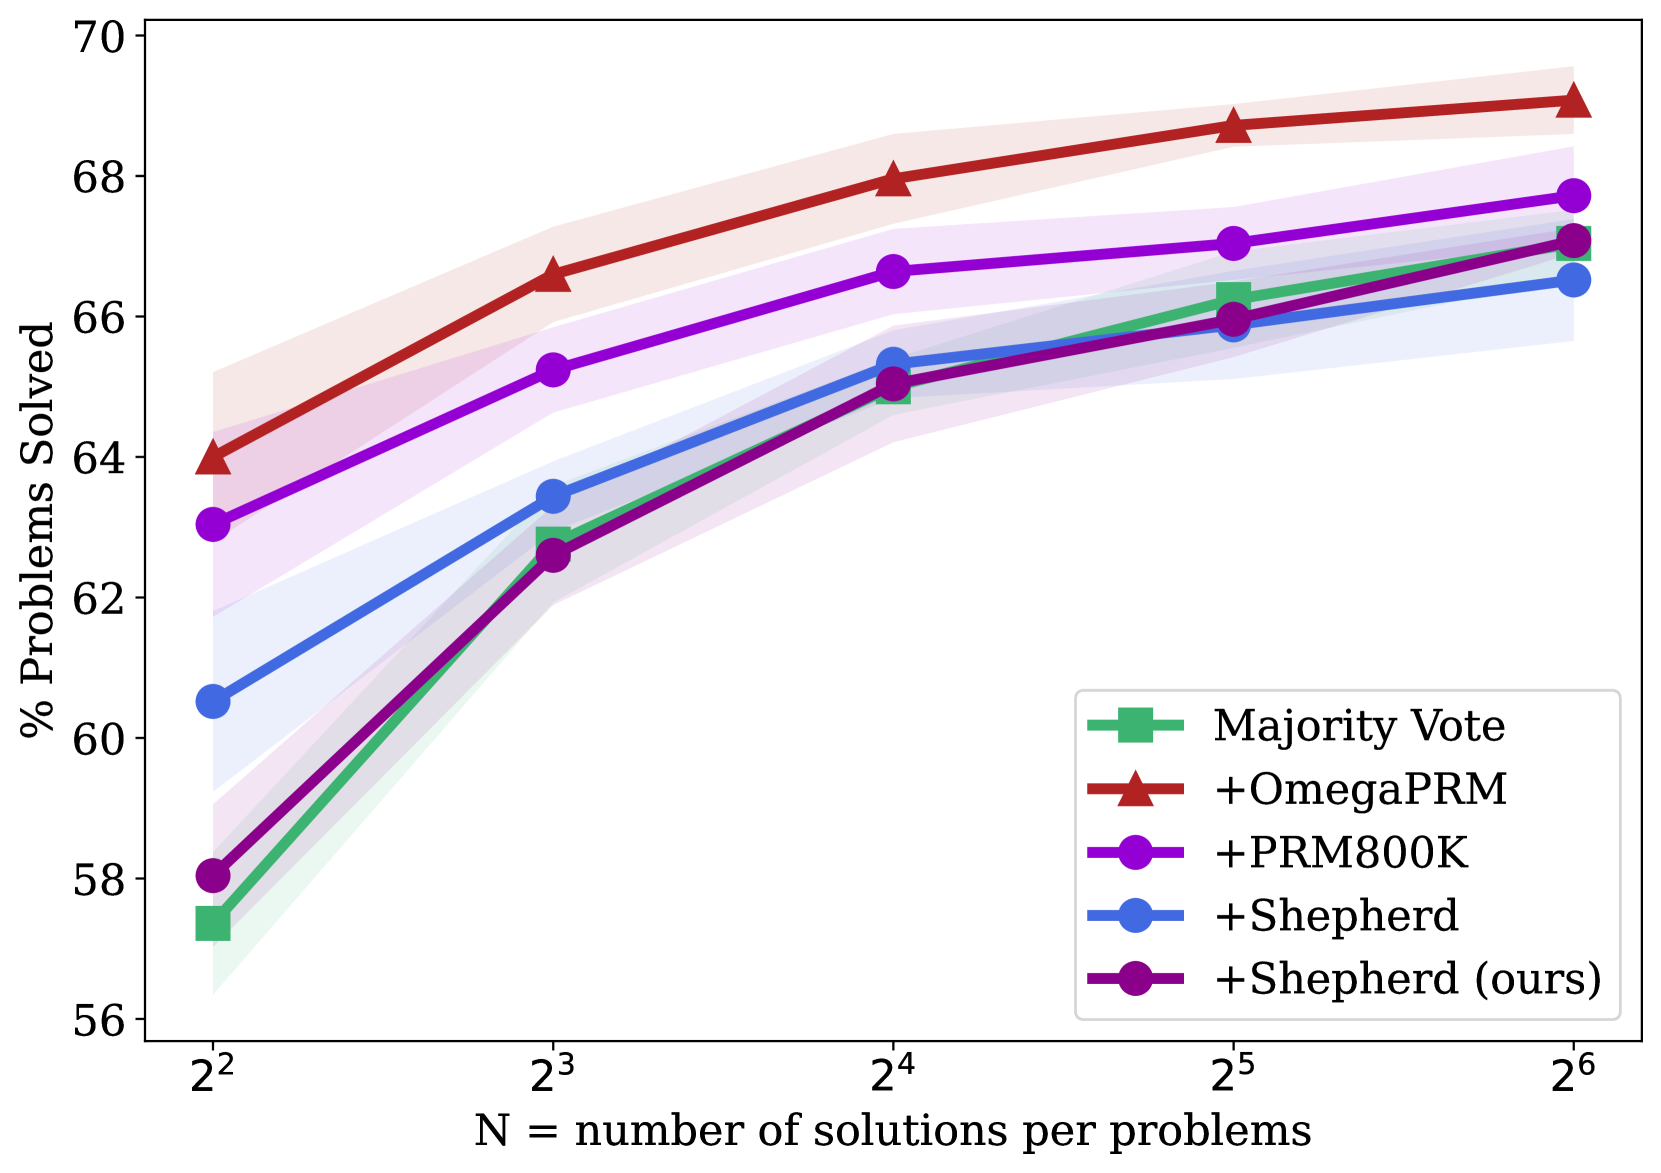
This line chart depicts the performance of different problem-solving algorithms as a function of the number of solutions generated per problem. The y-axis represents the percentage of problems solved, while the x-axis represents the number of solutions (N), expressed as powers of 2. Five algorithms are compared: Majority Vote, +OmegaPRM, +PRM800K, +Shepherd, and +Shepherd (ours).
### Components/Axes
* **X-axis Title:** N = number of solutions per problems
* **Y-axis Title:** % Problems Solved
* **X-axis Scale:** Logarithmic, with markers at 2<sup>2</sup>, 2<sup>3</sup>, 2<sup>4</sup>, 2<sup>5</sup>, and 2<sup>6</sup> (corresponding to 4, 8, 16, 32, and 64).
* **Y-axis Scale:** Linear, ranging from approximately 56% to 70%.
* **Legend:** Located in the bottom-right corner.
* Majority Vote (Green)
* +OmegaPRM (Red)
* +PRM800K (Magenta)
* +Shepherd (Blue)
* +Shepherd (ours) (Dark Purple)
### Detailed Analysis
Here's a breakdown of each line's trend and approximate data points, verifying color consistency with the legend:
* **Majority Vote (Green):** The line slopes upward, but with diminishing returns.
* N = 4: ~58%
* N = 8: ~62%
* N = 16: ~65%
* N = 32: ~66.5%
* N = 64: ~67%
* **+OmegaPRM (Red):** This line shows a consistent upward trend, with a relatively steep slope initially, then flattening out. It consistently outperforms the other algorithms.
* N = 4: ~64%
* N = 8: ~66%
* N = 16: ~67.5%
* N = 32: ~68%
* N = 64: ~68.5%
* **+PRM800K (Magenta):** The line starts relatively low, then increases more rapidly than Majority Vote, but remains below +OmegaPRM.
* N = 4: ~58%
* N = 8: ~63%
* N = 16: ~66%
* N = 32: ~67%
* N = 64: ~67.5%
* **+Shepherd (Blue):** This line exhibits a significant increase between N=4 and N=8, then plateaus.
* N = 4: ~60%
* N = 8: ~64%
* N = 16: ~65%
* N = 32: ~66%
* N = 64: ~66.5%
* **+Shepherd (ours) (Dark Purple):** This line shows a steady increase, starting slightly below +Shepherd, and eventually surpassing it.
* N = 4: ~63%
* N = 8: ~65%
* N = 16: ~66%
* N = 32: ~67%
* N = 64: ~67.5%
### Key Observations
* +OmegaPRM consistently achieves the highest percentage of problems solved across all values of N.
* Majority Vote has the lowest performance.
* The performance gains from increasing N diminish as N increases for all algorithms.
* "+Shepherd (ours)" outperforms "+Shepherd" at higher values of N.
* The largest performance jump for +Shepherd occurs between N=4 and N=8.
### Interpretation
The chart demonstrates the effectiveness of different algorithms in solving problems as the number of potential solutions explored increases. The superior performance of +OmegaPRM suggests it is a more efficient algorithm for this type of problem. The diminishing returns observed with increasing N indicate that there's a point where generating more solutions provides limited additional benefit. The improvement of "+Shepherd (ours)" over "+Shepherd" suggests that the modifications made in the "ours" version are beneficial, particularly when a larger number of solutions are considered. The data suggests a trade-off between computational cost (generating more solutions) and problem-solving success. The logarithmic scale on the x-axis highlights the impact of doubling the number of solutions at lower values of N, where the performance gains are more substantial.