## Line Graph: Percentage of Problems Solved vs. Number of Solutions per Problem
### Overview
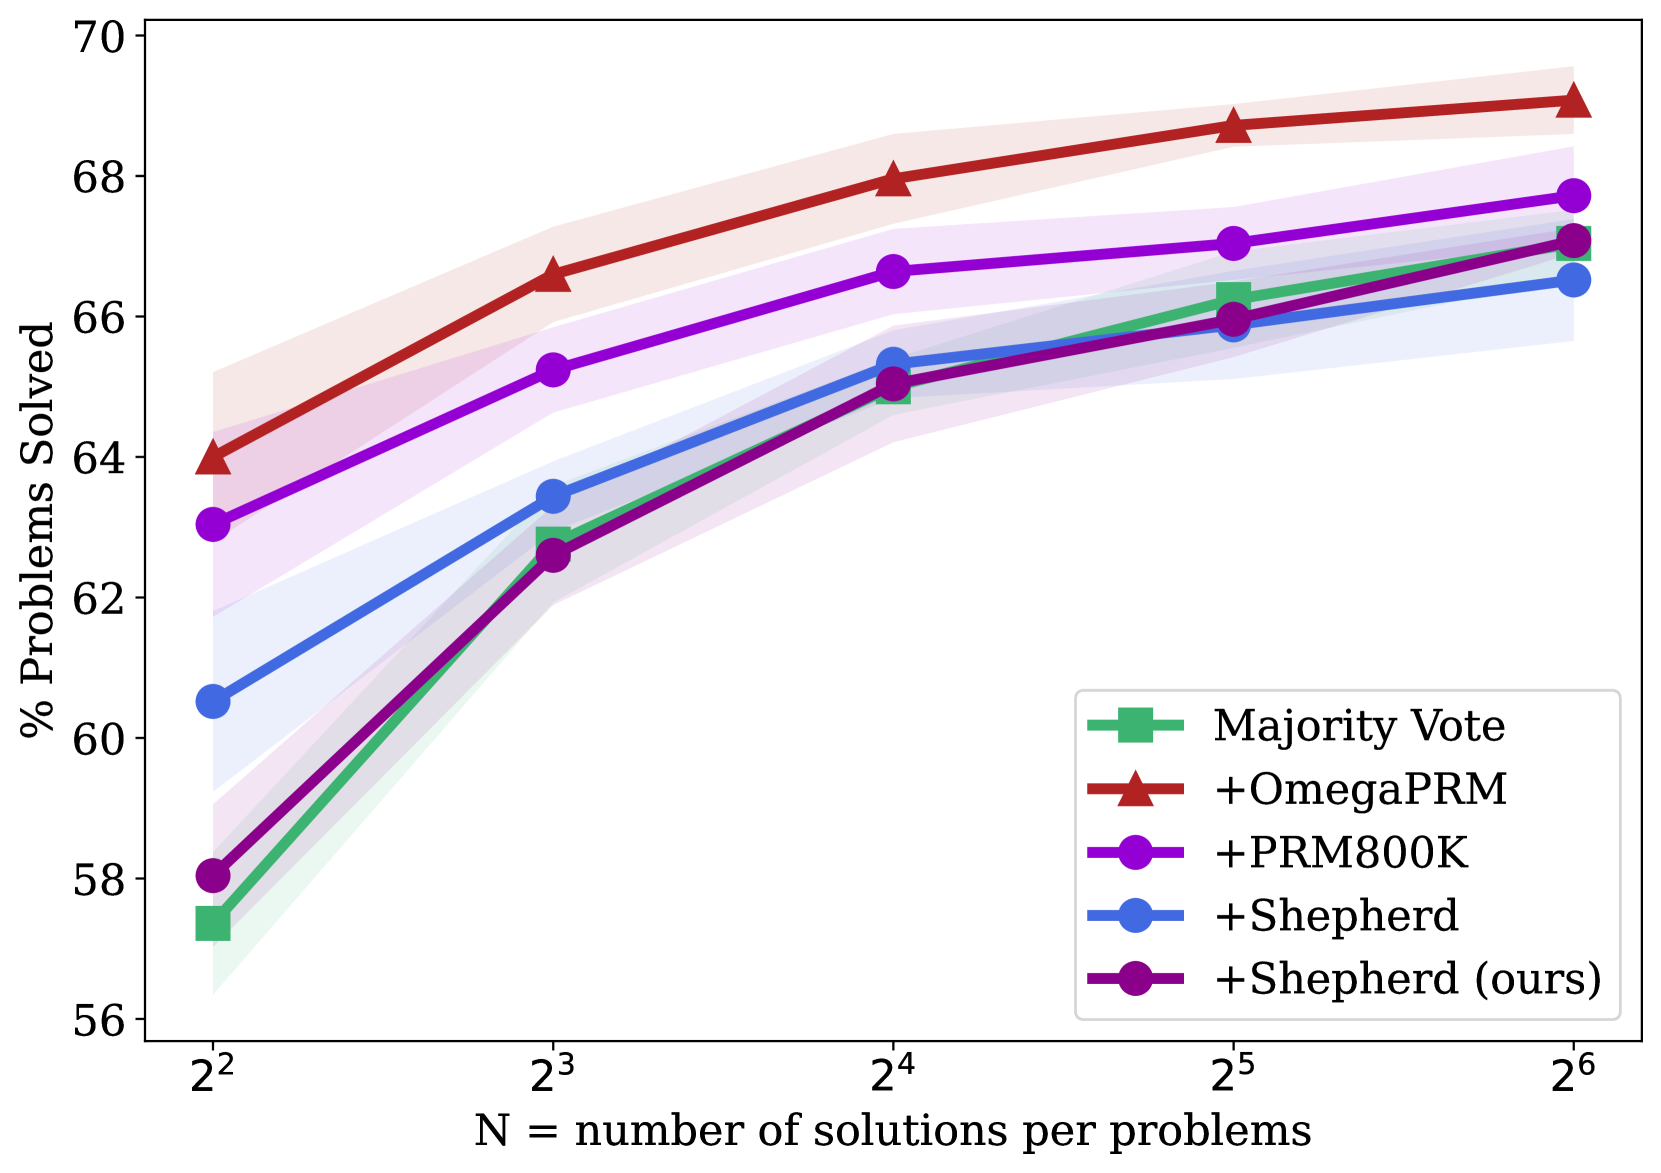
The graph illustrates the performance of five algorithms in solving problems as the number of solutions per problem (N) increases. The y-axis represents the percentage of problems solved (56–70%), and the x-axis represents N, ranging from 2² to 2⁶. Five algorithms are compared: Majority Vote, +OmegaPRM, +PRM800K, +Shepherd, and +Shepherd (ours). All algorithms show upward trends, but with varying rates of improvement.
### Components/Axes
- **X-axis**: Labeled "N = number of solutions per problems," with markers at 2², 2³, 2⁴, 2⁵, and 2⁶.
- **Y-axis**: Labeled "% Problems Solved," ranging from 56% to 70%.
- **Legend**: Located in the bottom-right corner, with the following mappings:
- Green squares: Majority Vote
- Red triangles: +OmegaPRM
- Purple circles: +PRM800K
- Blue circles: +Shepherd
- Purple diamonds: +Shepherd (ours)
### Detailed Analysis
1. **Majority Vote (Green Squares)**:
- Starts at ~57.5% at 2².
- Increases steadily to ~67% at 2⁶.
- Slope is moderate compared to other algorithms.
2. **+OmegaPRM (Red Triangles)**:
- Starts at ~64% at 2².
- Shows the steepest upward trend, reaching ~69% at 2⁶.
- Consistently outperforms all other algorithms.
3. **+PRM800K (Purple Circles)**:
- Starts at ~63% at 2².
- Increases to ~67.5% at 2⁶.
- Slope is slightly less steep than +OmegaPRM but higher than others.
4. **+Shepherd (Blue Circles)**:
- Starts at ~60.5% at 2².
- Reaches ~66.5% at 2⁶.
- Shows a consistent upward trend but lags behind +OmegaPRM and +PRM800K.
5. **+Shepherd (ours) (Purple Diamonds)**:
- Starts at ~58% at 2².
- Ends at ~67% at 2⁶.
- Demonstrates the largest improvement over the range, surpassing +Shepherd (blue) at higher N values.
### Key Observations
- **+OmegaPRM** maintains the highest performance across all N values, with the steepest improvement.
- **+PRM800K** and **+Shepherd (ours)** show strong performance, with the latter catching up to +Shepherd (blue) at higher N.
- **Majority Vote** has the lowest starting performance but improves significantly, though it remains the least effective overall.
- All algorithms exhibit diminishing returns as N increases, with performance gains slowing at higher N values.
### Interpretation
The data suggests that **+OmegaPRM** is the most effective algorithm for solving problems, particularly as the number of solutions per problem increases. The Shepherd variants (+Shepherd and +Shepherd (ours)) demonstrate competitive performance, with the latter showing the most improvement over the range. The Majority Vote algorithm, while improving, remains the least effective. The trends indicate that increasing the number of solutions per problem generally enhances problem-solving capability, but the efficiency of this improvement varies by algorithm. Notably, +Shepherd (ours) outperforms the standard +Shepherd at higher N values, suggesting potential optimizations in the "ours" variant.