## Chart: Hits@1 vs. latency on CWQ
### Overview
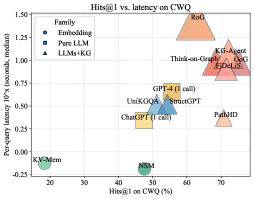
This is a scatter plot showing the relationship between Hits@1 on CWQ (percentage) and per-query latency (seconds, median) for different language model families. The plot distinguishes between Embedding models, Pure LLM models, and LLMs+KG models using different shapes and colors.
### Components/Axes
* **Title:** Hits@1 vs. latency on CWQ
* **X-axis:** Hits@1 on CWQ (%)
* Scale ranges from approximately 15% to 75% with tick marks at 20, 30, 40, 50, 60, and 70.
* **Y-axis:** Per-query latency 10'x (seconds, median)
* Scale ranges from -0.25 to 1.50 with tick marks at -0.25, 0.00, 0.25, 0.50, 0.75, 1.00, 1.25, and 1.50.
* **Legend (top-left):**
* Embedding: Blue circle
* Pure LLM: Blue square
* LLMs+KG: Blue triangle
### Detailed Analysis
The data points are scattered across the plot, with some clustering in certain regions.
* **Embedding Models:**
* KV-Mem: Located at approximately (18%, -0.15 seconds).
* NSM: Located at approximately (48%, -0.15 seconds).
* Both are represented by blue circles.
* **Pure LLM Models:**
* ChatGPT (1 call): Located at approximately (45%, 0.3 seconds).
* StructGPT: Located at approximately (58%, 0.5 seconds).
* GPT-4 (1 call): Located at approximately (55%, 0.6 seconds).
* UniKGOA: Located at approximately (52%, 0.5 seconds).
* All are represented by blue squares.
* **LLMs+KG Models:**
* PathHD: Located at approximately (70%, 0.3 seconds).
* EjDeLiS: Located at approximately (72%, 0.8 seconds).
* GoG: Located at approximately (70%, 0.9 seconds).
* KG-Agent: Located at approximately (70%, 1.0 seconds).
* Think-on-Graph: Located at approximately (65%, 1.0 seconds).
* RoG: Located at approximately (60%, 1.3 seconds).
* All are represented by blue triangles.
### Key Observations
* There appears to be a general trend where higher Hits@1 on CWQ is associated with higher per-query latency.
* Embedding models (KV-Mem, NSM) have the lowest latency but also the lowest Hits@1.
* LLMs+KG models generally have higher Hits@1 but also higher latency.
* Pure LLM models are clustered in the middle range for both metrics.
### Interpretation
The plot suggests a trade-off between accuracy (Hits@1) and speed (latency) for different language model families. Embedding models are fast but less accurate, while LLMs+KG models are more accurate but slower. Pure LLM models offer a balance between the two. The specific models mentioned (ChatGPT, GPT-4, etc.) provide benchmarks for performance within these categories. The data indicates that incorporating knowledge graphs (KG) into language models tends to improve accuracy at the cost of increased latency. The outlier RoG has the highest latency and a high Hits@1 score.