\n
## Scatter Plot: Hits@1 vs. latency on CWQ
### Overview
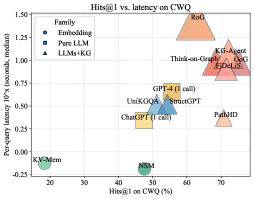
The image is a scatter plot comparing various AI models and systems on two performance metrics: accuracy (Hits@1 on the CWQ benchmark) and speed (per-query latency). The plot categorizes models into three families, distinguished by color and marker shape, showing a general trade-off between higher accuracy and increased latency.
### Components/Axes
* **Title:** "Hits@1 vs. latency on CWQ"
* **X-Axis:** "Hits@1 on CWQ (%)". Scale ranges from 0 to 80, with major ticks at 0, 20, 40, 60, 80.
* **Y-Axis:** "Per-query latency (seconds, median)". Scale ranges from -0.25 to 1.50, with major ticks at -0.25, 0.00, 0.25, 0.50, 0.75, 1.00, 1.25, 1.50.
* **Legend (Top-Left Corner):**
* **Family:** (Header)
* **Fine-tuning:** Green square marker.
* **Pure LLM:** Blue circle marker.
* **LLMs+KG:** Orange triangle marker.
### Detailed Analysis
The plot contains 10 distinct data points, each labeled with a model/system name. Their approximate coordinates (x=Hits@1 %, y=Latency seconds) are as follows:
**Fine-tuning Family (Green Squares):**
1. **XVSMon:** Positioned at the far left and bottom. Approximate coordinates: (10%, -0.15s). This indicates very low accuracy and the lowest latency on the chart.
2. **GPT4-T:** Positioned near the center-bottom. Approximate coordinates: (40%, -0.10s). Shows moderate accuracy with very low latency.
**Pure LLM Family (Blue Circles):**
3. **ChatQA-2:** Positioned left of center. Approximate coordinates: (35%, 0.25s).
4. **UnkQA:** Positioned near the center. Approximate coordinates: (45%, 0.35s).
5. **GPT-4 (1-shot):** Positioned right of center. Approximate coordinates: (50%, 0.40s). This cluster shows a trend of increasing latency with modest gains in accuracy.
**LLMs+KG Family (Orange Triangles):**
6. **PaLM2:** Positioned on the right side, lower than its group. Approximate coordinates: (70%, 0.20s). An outlier within its family, showing high accuracy with relatively low latency.
7. **Think-and-Execute:** Positioned in the upper-right quadrant. Approximate coordinates: (65%, 0.85s).
8. **KG-GPT:** Positioned in the upper-right quadrant. Approximate coordinates: (75%, 0.90s).
9. **KG-LLaMA:** Positioned in the upper-right quadrant. Approximate coordinates: (72%, 1.00s).
10. **RoG:** Positioned at the top of the chart. Approximate coordinates: (60%, 1.40s). This model has the highest latency by a significant margin.
### Key Observations
1. **Clear Family Clustering:** The three model families form distinct clusters. "Fine-tuning" models are in the low-latency, low-to-moderate accuracy region (bottom-left). "Pure LLM" models form a central cluster with moderate latency and accuracy. "LLMs+KG" models dominate the high-accuracy region (right side) but with a wide spread in latency.
2. **Accuracy-Latency Trade-off:** There is a general positive correlation between Hits@1 accuracy and latency. Moving from left to right (increasing accuracy), the data points generally move upward (increasing latency).
3. **Notable Outliers:**
* **PaLM2 (LLMs+KG):** Achieves high accuracy (~70%) with latency (~0.20s) comparable to the "Pure LLM" cluster, making it highly efficient.
* **RoG (LLMs+KG):** Has the highest latency (~1.40s) but only moderate accuracy (~60%), suggesting a potential inefficiency.
* **XVSMon (Fine-tuning):** Has the lowest accuracy and latency, potentially representing a very fast but less capable baseline.
### Interpretation
This chart visualizes the performance landscape of different approaches to complex question answering (on the CWQ benchmark). The data suggests a fundamental trade-off: achieving higher accuracy (Hits@1) typically requires more computational time (latency).
* **Fine-tuning** approaches (green) prioritize speed, offering the lowest latencies but at a significant cost to accuracy. They are suitable for scenarios where response time is critical and some error is acceptable.
* **Pure LLM** approaches (blue) represent a middle ground, offering a balance between reasonable accuracy and moderate speed.
* **LLMs augmented with Knowledge Graphs (LLMs+KG)** (orange) generally achieve the highest accuracy, demonstrating the value of structured knowledge for complex reasoning. However, this comes at the cost of higher and more variable latency, likely due to the overhead of KG retrieval and integration. The wide latency spread within this group (from PaLM2's ~0.20s to RoG's ~1.40s) indicates significant differences in the efficiency of their KG integration mechanisms.
The standout model is **PaLM2**, which breaks the general trend by delivering high accuracy with low latency, suggesting a particularly efficient architecture or integration method. Conversely, **RoG** appears to be the least efficient, incurring a very high latency penalty for its level of accuracy. This analysis would be crucial for a practitioner selecting a model based on their specific constraints for accuracy versus response time.