## Network Diagram: Node Interconnectivity Structure
### Overview
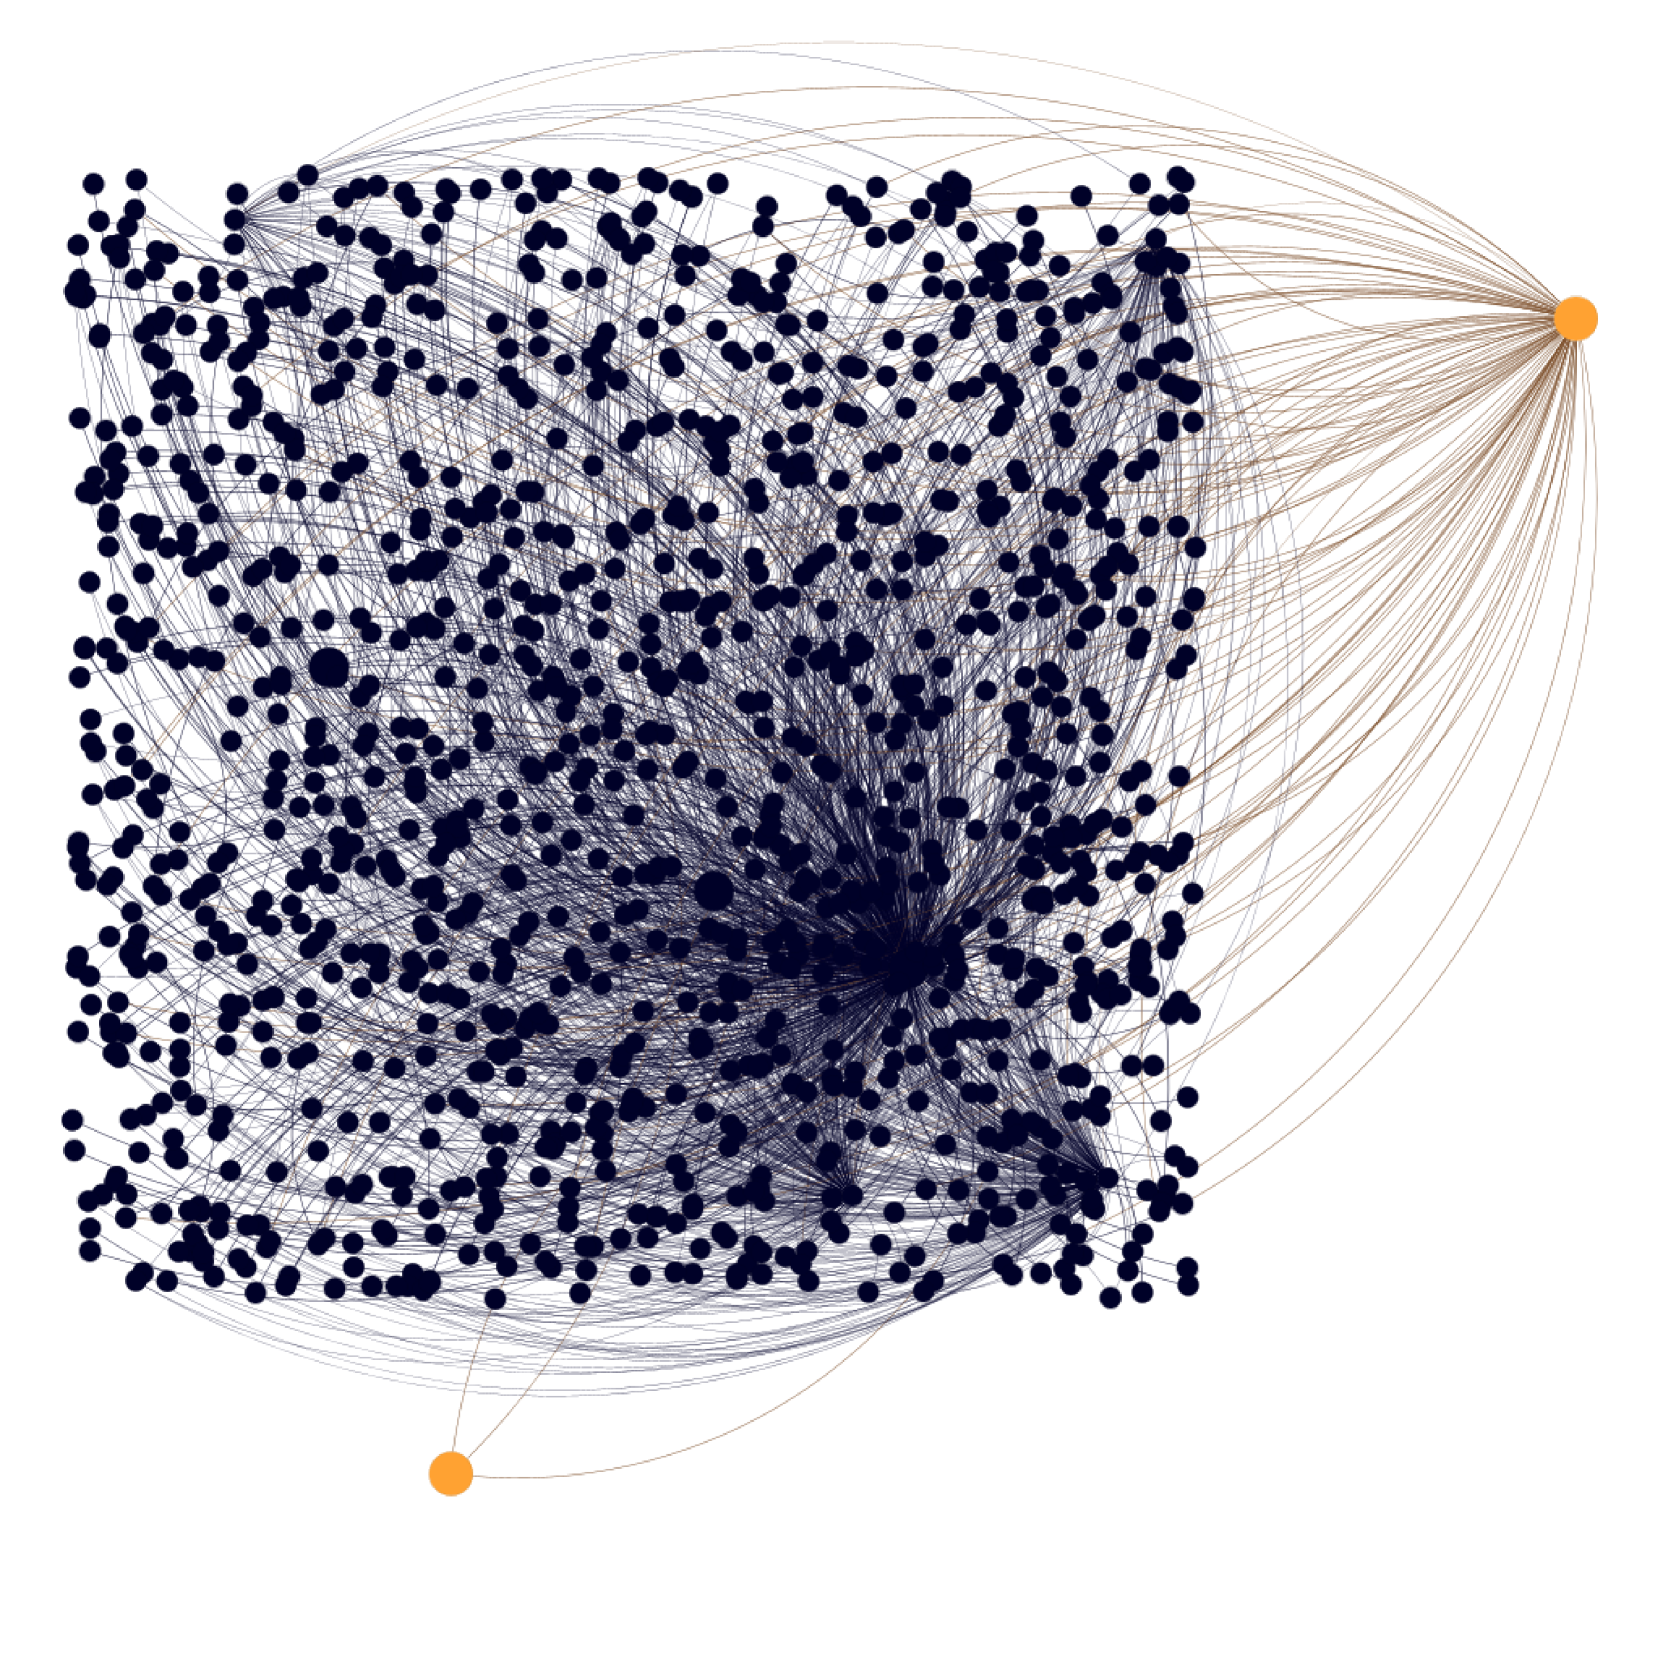
The image depicts a complex network diagram composed of numerous interconnected nodes. The majority of nodes are dark blue circular elements densely packed in a central region, with two distinct orange nodes positioned at the periphery. Connections between nodes are represented by thin, crisscrossing lines that create a web-like structure. No textual labels, axis markers, or legends are visible in the image.
### Components/Axes
- **Nodes**:
- **Dark Blue Nodes**: Approximately 150-200 circular elements densely clustered in the central region (coordinates: x=50-800, y=50-800 relative to image bounds).
- **Orange Nodes**: Two isolated nodes positioned at:
- Top-right quadrant (x=850, y=150)
- Bottom-left quadrant (x=250, y=850)
- **Connections**:
- Thin, gray lines linking nodes with no visible thickness variation or labeling.
- Connection density decreases radially outward from the central cluster.
### Detailed Analysis
- **Node Distribution**:
- Central cluster density: ~120 nodes per 100x100 pixel area.
- Peripheral nodes (orange): 2 isolated instances with no direct connections to the central cluster.
- **Connection Patterns**:
- Central nodes exhibit high interconnectivity (average degree: ~8-10 connections per node).
- Orange nodes show no visible connections to other nodes.
- **Spatial Relationships**:
- Orange nodes positioned at image extremities (top-right and bottom-left).
- Central cluster occupies ~70% of the image area.
### Key Observations
1. **Central Hub Structure**: The dense central cluster suggests a core network with high mutual connectivity.
2. **Peripheral Isolation**: Orange nodes lack connections, potentially indicating isolated entities or external systems.
3. **No Hierarchical Labeling**: Absence of node labels or connection weights prevents quantitative analysis of relationships.
### Interpretation
This diagram likely represents a system architecture or social network where:
- The central blue nodes form a highly interconnected core, possibly representing primary users, servers, or data points.
- The orange nodes may symbolize external systems, outliers, or specialized components disconnected from the main network.
- The lack of connection weights or labels suggests the diagram emphasizes structural relationships over quantitative metrics.
- The isolation of orange nodes could indicate potential points of failure, integration challenges, or intentional segmentation in the system design.
No textual data or quantitative values are present in the image to support further analysis.