## Chart: Model Performance vs. Budget
### Overview
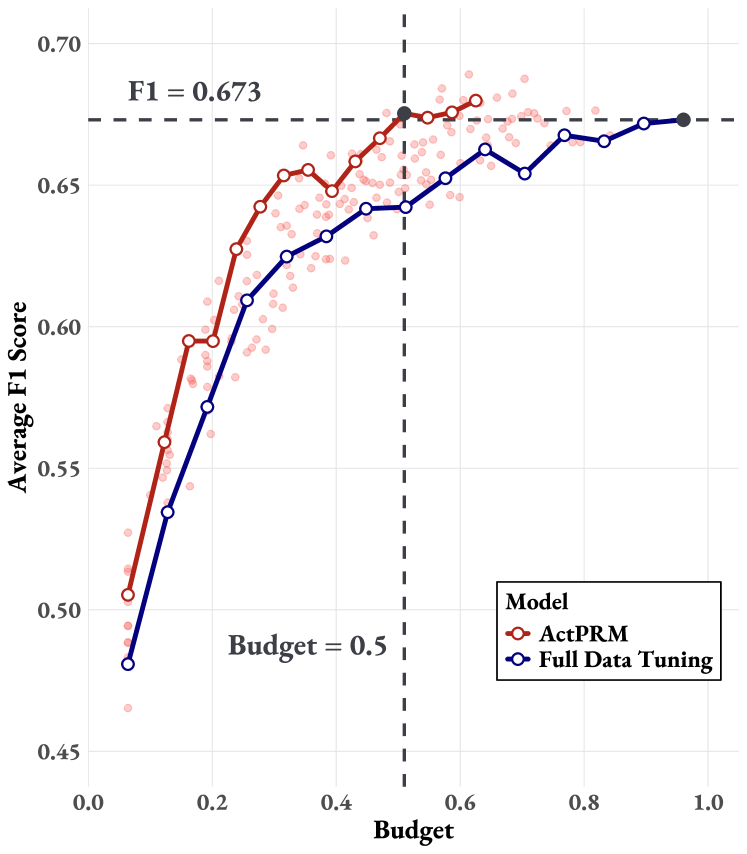
The image is a line chart comparing the performance of two models, "ActPRM" and "Full Data Tuning," as a function of "Budget." Performance is measured by "Average F1 Score." The chart also includes horizontal and vertical dashed lines indicating specific values for F1 score and Budget, respectively.
### Components/Axes
* **X-axis:** "Budget," ranging from 0.0 to 1.0 in increments of 0.2.
* **Y-axis:** "Average F1 Score," ranging from 0.45 to 0.70 in increments of 0.05.
* **Legend (bottom-right):**
* "ActPRM" (red line with red data points)
* "Full Data Tuning" (blue line with white-filled blue data points)
* **Horizontal dashed line:** Indicates F1 = 0.673.
* **Vertical dashed line:** Indicates Budget = 0.5.
* **Text labels:** "F1 = 0.673" (near the horizontal line) and "Budget = 0.5" (near the vertical line).
### Detailed Analysis
* **ActPRM (red):**
* Trend: The red line generally slopes upward, indicating increasing F1 score with increasing budget. The slope decreases as the budget approaches 1.0.
* Data points:
* Budget 0.0: F1 score approximately 0.50
* Budget 0.2: F1 score approximately 0.62
* Budget 0.4: F1 score approximately 0.65
* Budget 0.6: F1 score approximately 0.68
* Budget 0.8: F1 score approximately 0.67
* Budget 1.0: F1 score approximately 0.67
* **Full Data Tuning (blue):**
* Trend: The blue line also generally slopes upward, but its increase is less steep than the red line, especially at lower budget values.
* Data points:
* Budget 0.0: F1 score approximately 0.48
* Budget 0.2: F1 score approximately 0.59
* Budget 0.4: F1 score approximately 0.64
* Budget 0.6: F1 score approximately 0.64
* Budget 0.8: F1 score approximately 0.66
* Budget 1.0: F1 score approximately 0.67
### Key Observations
* At lower budget values (e.g., 0.2), ActPRM outperforms Full Data Tuning.
* As the budget increases, the performance of both models converges.
* The F1 score of ActPRM plateaus around 0.67 for budgets greater than 0.6.
* The F1 score of Full Data Tuning appears to be still increasing slightly at a budget of 1.0.
* The horizontal dashed line intersects the ActPRM line near a budget of 0.6 and the Full Data Tuning line near a budget of 1.0.
### Interpretation
The chart suggests that ActPRM is more efficient at lower budget levels, achieving a higher F1 score compared to Full Data Tuning with the same budget. However, as the budget increases, the performance gap between the two models diminishes. The horizontal line at F1 = 0.673 indicates a target performance level. ActPRM reaches this level at a lower budget than Full Data Tuning, suggesting it's a more cost-effective option if the goal is to achieve an F1 score of approximately 0.67. The vertical line at Budget = 0.5 could represent a budget constraint, and the chart shows the relative performance of each model under that constraint.