## Line Graph: Average F1 Score vs. Budget for Two Models
### Overview
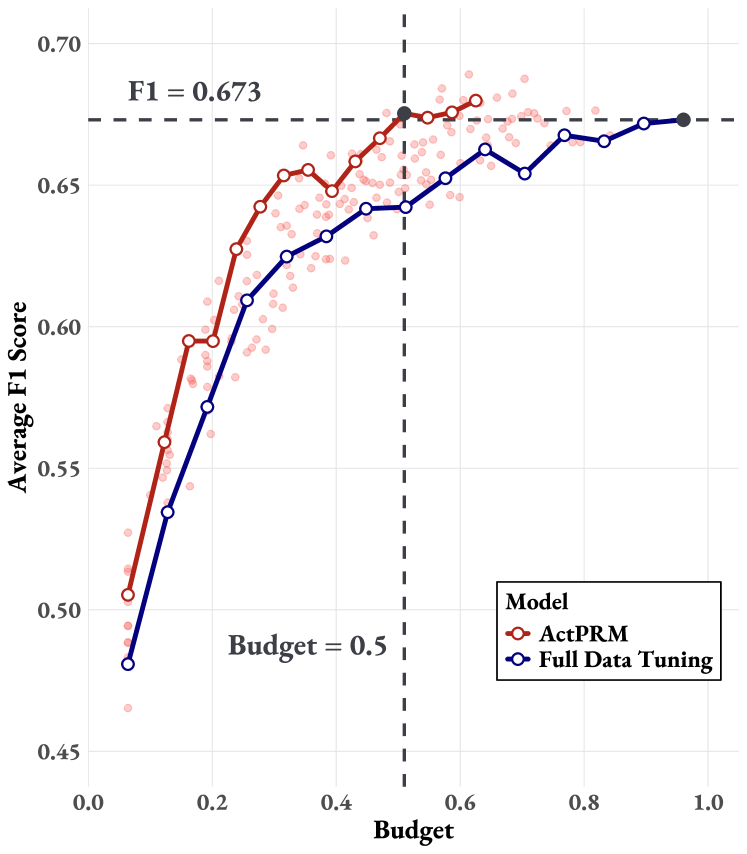
The image is a line graph comparing the performance of two models (ActPRM and Full Data Tuning) across varying budget levels. The x-axis represents "Budget" (0.0 to 1.0), and the y-axis represents "Average F1 Score" (0.45 to 0.70). Two dashed reference lines are present: a vertical line at Budget = 0.5 and a horizontal line at F1 = 0.673. The graph includes data points with uncertainty (scatter) and trend lines for both models.
---
### Components/Axes
- **X-axis (Budget)**: Ranges from 0.0 to 1.0 in increments of 0.1. Labeled "Budget."
- **Y-axis (Average F1 Score)**: Ranges from 0.45 to 0.70 in increments of 0.05. Labeled "Average F1 Score."
- **Legend**: Located in the bottom-right corner.
- Red line with circular markers: "ActPRM"
- Blue line with circular markers: "Full Data Tuning"
- **Dashed Lines**:
- Vertical line at Budget = 0.5 (labeled "Budget = 0.5").
- Horizontal line at F1 = 0.673 (labeled "F1 = 0.673").
---
### Detailed Analysis
#### ActPRM (Red Line)
- **Trend**: Starts at ~0.51 F1 at Budget = 0.0, rises sharply to ~0.673 at Budget = 0.5, then fluctuates slightly downward to ~0.66 at Budget = 1.0.
- **Key Data Points**:
- Budget = 0.0: ~0.51 F1
- Budget = 0.2: ~0.59 F1
- Budget = 0.4: ~0.64 F1
- Budget = 0.5: ~0.673 F1 (peak)
- Budget = 0.8: ~0.66 F1
- Budget = 1.0: ~0.66 F1
#### Full Data Tuning (Blue Line)
- **Trend**: Starts at ~0.48 F1 at Budget = 0.0, rises steadily, surpassing ActPRM after Budget = 0.5, and plateaus near ~0.68 F1 at Budget = 1.0.
- **Key Data Points**:
- Budget = 0.0: ~0.48 F1
- Budget = 0.2: ~0.56 F1
- Budget = 0.4: ~0.63 F1
- Budget = 0.5: ~0.64 F1 (overtakes ActPRM)
- Budget = 0.8: ~0.67 F1
- Budget = 1.0: ~0.68 F1
#### Scatter Points
- Red and blue scatter points (with uncertainty) are distributed around the trend lines, showing variability in performance across trials.
---
### Key Observations
1. **Crossover Point**: Full Data Tuning surpasses ActPRM at Budget = 0.5, where the vertical dashed line is drawn.
2. **F1 Score Threshold**: The horizontal line at F1 = 0.673 indicates a performance benchmark. ActPRM reaches this threshold at Budget = 0.5, while Full Data Tuning exceeds it by Budget = 0.8.
3. **Performance Trends**:
- ActPRM shows diminishing returns after Budget = 0.5.
- Full Data Tuning demonstrates consistent improvement up to Budget = 1.0.
---
### Interpretation
- **Model Efficiency**: Full Data Tuning achieves higher F1 scores with the same or lower budget compared to ActPRM, suggesting better resource utilization.
- **Diminishing Returns**: ActPRM’s performance plateaus after Budget = 0.5, indicating limited gains from additional budget allocation.
- **Benchmark Significance**: The F1 = 0.673 threshold may represent a target for acceptable performance, with Full Data Tuning being more reliable for exceeding this benchmark.
- **Uncertainty**: Scatter points suggest variability in model performance, with ActPRM showing higher variance (wider spread of red points) compared to Full Data Tuning.
This analysis highlights the trade-offs between model complexity (ActPRM) and data-driven tuning (Full Data Tuning) in achieving optimal performance under budget constraints.