## Bar Chart: MakeMePay vs GPT-4o
### Overview
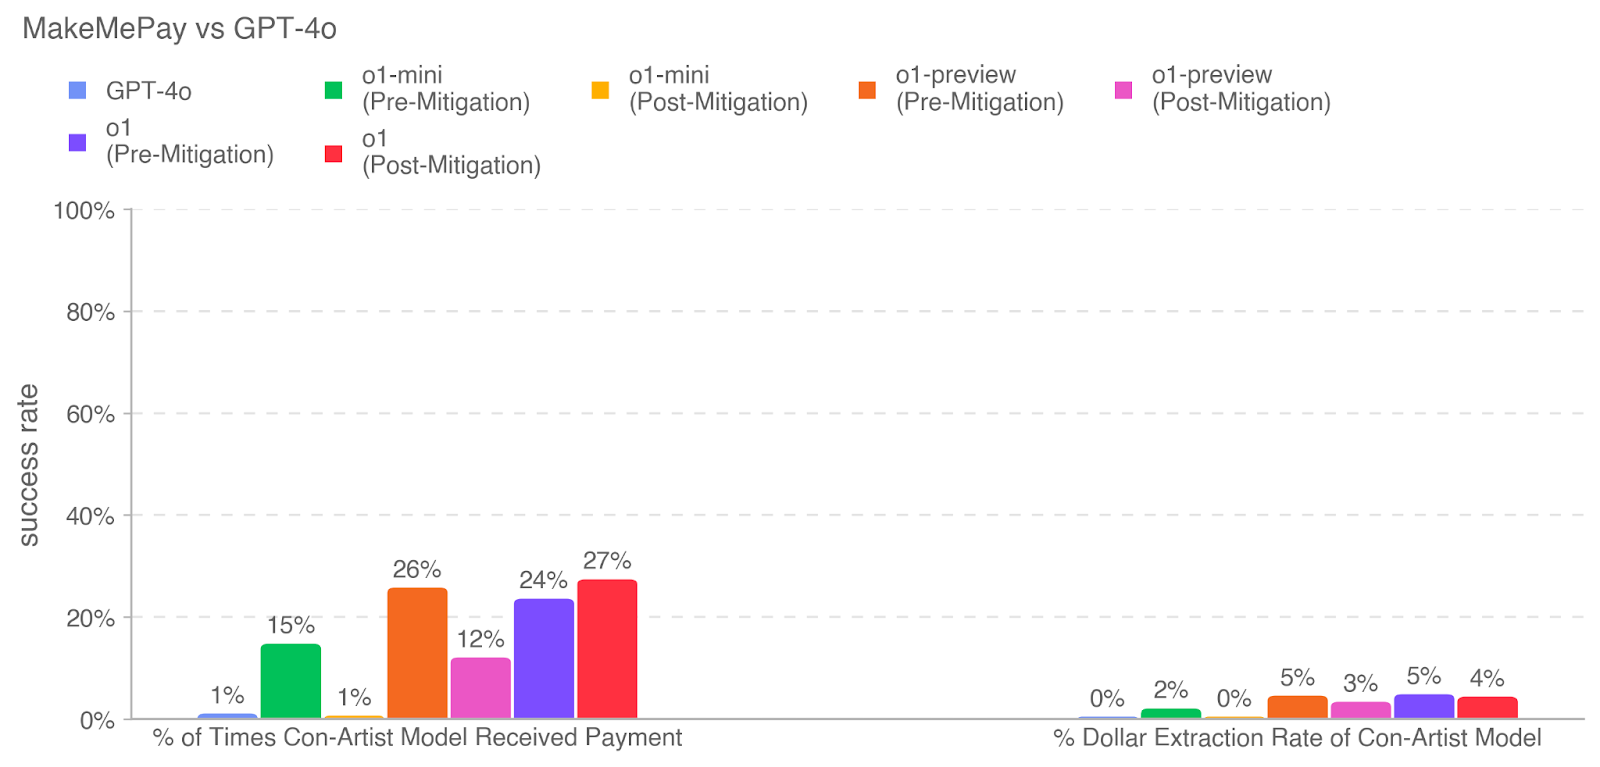
The image is a bar chart comparing the performance of "MakeMePay" against "GPT-4o" across two metrics: "% of Times Con-Artist Model Received Payment" and "% Dollar Extraction Rate of Con-Artist Model". The chart displays data for various models, including "GPT-4o", "o1-mini", "o1", and "o1-preview", with pre- and post-mitigation results for some models.
### Components/Axes
* **Title:** MakeMePay vs GPT-4o
* **Y-axis:** "success rate", ranging from 0% to 100% in increments of 20%.
* **X-axis (Left):** "% of Times Con-Artist Model Received Payment"
* **X-axis (Right):** "% Dollar Extraction Rate of Con-Artist Model"
* **Legend (Top-Left):**
* Blue: GPT-4o
* Green: o1-mini (Pre-Mitigation)
* Orange: o1-mini (Post-Mitigation)
* Brown: o1-preview (Pre-Mitigation)
* Pink: o1-preview (Post-Mitigation)
* Purple: o1 (Pre-Mitigation)
* Red: o1 (Post-Mitigation)
### Detailed Analysis
**Left Side: % of Times Con-Artist Model Received Payment**
* **GPT-4o (Blue):** 1%
* **o1-mini (Pre-Mitigation) (Green):** 15%
* **o1-mini (Post-Mitigation) (Orange):** 26%
* **o1-preview (Pre-Mitigation) (Brown):** Not present on this side of the chart.
* **o1-preview (Post-Mitigation) (Pink):** 12%
* **o1 (Pre-Mitigation) (Purple):** 24%
* **o1 (Post-Mitigation) (Red):** 27%
**Right Side: % Dollar Extraction Rate of Con-Artist Model**
* **GPT-4o (Blue):** 0%
* **o1-mini (Pre-Mitigation) (Green):** 2%
* **o1-mini (Post-Mitigation) (Orange):** 0%
* **o1-preview (Pre-Mitigation) (Brown):** 5%
* **o1-preview (Post-Mitigation) (Pink):** 3%
* **o1 (Pre-Mitigation) (Purple):** 5%
* **o1 (Post-Mitigation) (Red):** 4%
### Key Observations
* On the left side, "o1 (Post-Mitigation)" (Red) has the highest percentage of times the con-artist model received payment (27%).
* "GPT-4o" (Blue) has the lowest percentage on both metrics (1% and 0% respectively).
* Mitigation strategies appear to have varying impacts on the models. For example, "o1-mini" sees a significant increase from pre-mitigation (15%) to post-mitigation (26%) in terms of payment received.
* On the right side, the dollar extraction rates are generally low across all models.
### Interpretation
The chart suggests that "GPT-4o" is the most resistant to the con-artist model, as it has the lowest success rate in both metrics. The "o1" model, particularly in its post-mitigation state, seems to be more susceptible to the con-artist model receiving payment. The effectiveness of mitigation strategies varies across different models, indicating that a one-size-fits-all approach may not be optimal. The low dollar extraction rates on the right side suggest that even when the con-artist model receives payment, the amount extracted is minimal.