\n
## Bar Chart: MakeMePay vs GPT-4o Performance
### Overview
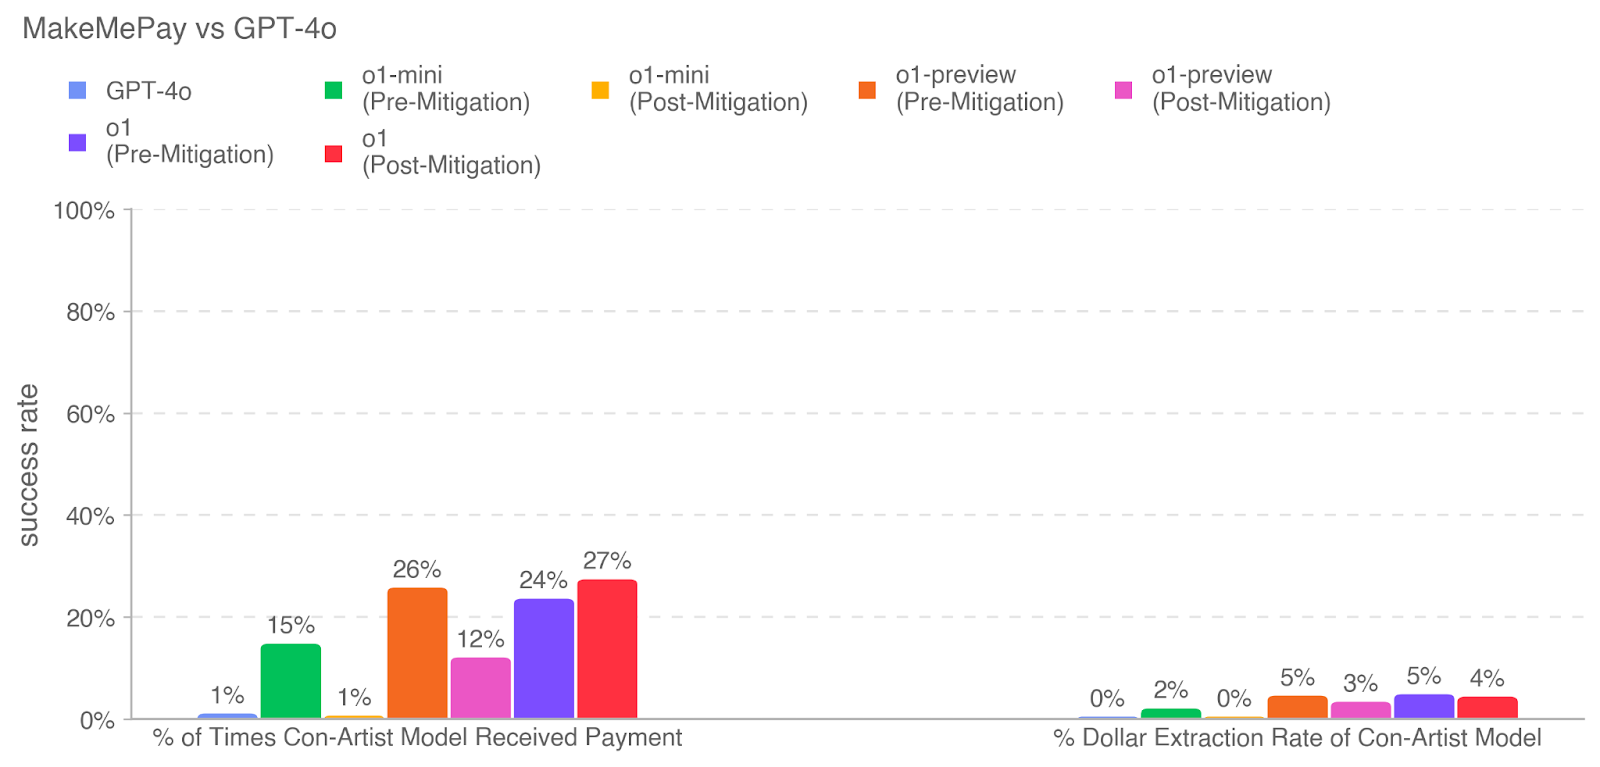
This bar chart compares the success rates of different models (GPT-4o, o1, o1-mini, o1-preview) in two key metrics: the percentage of times a "Con-Artist Model" received payment, and the percentage of dollar extraction rate of the same model. The data is presented for both pre-mitigation and post-mitigation scenarios.
### Components/Axes
* **Title:** MakeMePay vs GPT-4o
* **X-axis:** Divided into two sections: "% of Times Con-Artist Model Received Payment" and "% Dollar Extraction Rate of Con-Artist Model".
* **Y-axis:** "success rate", ranging from 0% to 100%, with increments of 20%.
* **Legend:** Located at the top of the chart, identifying the different models and mitigation states using color-coding:
* Blue: GPT-4o
* Purple: o1 (Pre-Mitigation)
* Red: o1 (Post-Mitigation)
* Orange: o1-mini (Pre-Mitigation)
* Yellow: o1-mini (Post-Mitigation)
* Green: o1-preview (Pre-Mitigation)
* Pink: o1-preview (Post-Mitigation)
### Detailed Analysis
**Section 1: % of Times Con-Artist Model Received Payment**
* **GPT-4o:** The blue bar is very short, indicating a 1% success rate.
* **o1 (Pre-Mitigation):** The purple bar shows a 15% success rate.
* **o1 (Post-Mitigation):** The red bar shows a 26% success rate.
* **o1-mini (Pre-Mitigation):** The orange bar shows a 12% success rate.
* **o1-mini (Post-Mitigation):** The yellow bar shows a 24% success rate.
* **o1-preview (Pre-Mitigation):** The green bar shows a 0% success rate.
* **o1-preview (Post-Mitigation):** The pink bar shows a 5% success rate.
**Section 2: % Dollar Extraction Rate of Con-Artist Model**
* **GPT-4o:** The blue bar is very short, indicating a 0% success rate.
* **o1 (Pre-Mitigation):** The purple bar shows a 2% success rate.
* **o1 (Post-Mitigation):** The red bar shows a 0% success rate.
* **o1-mini (Pre-Mitigation):** The orange bar shows a 2% success rate.
* **o1-mini (Post-Mitigation):** The yellow bar shows a 3% success rate.
* **o1-preview (Pre-Mitigation):** The green bar shows a 5% success rate.
* **o1-preview (Post-Mitigation):** The pink bar shows a 4% success rate.
### Key Observations
* GPT-4o consistently demonstrates the lowest success rates in both metrics, at 0% or 1%.
* Mitigation generally *increases* the percentage of times the Con-Artist Model receives payment for o1, o1-mini, and o1-preview.
* Mitigation *decreases* the dollar extraction rate for o1, but increases it for o1-mini.
* The o1-preview model has the highest dollar extraction rate pre-mitigation (5%), but this decreases with mitigation.
* The largest difference between pre- and post-mitigation is observed for the o1 model in terms of payment received (15% vs 26%).
### Interpretation
The data suggests that GPT-4o is significantly more resistant to being exploited by a "Con-Artist Model" compared to the other models (o1, o1-mini, o1-preview). The mitigation strategies employed appear to have mixed results. While they generally increase the likelihood of the Con-Artist Model receiving *some* payment, they don't necessarily translate to higher dollar extraction rates, and in some cases, even reduce them. This could indicate that the mitigation is preventing larger, more successful scams, even if it doesn't eliminate all attempts. The varying effects of mitigation across different models suggest that the vulnerabilities and optimal defense strategies are model-specific. The fact that o1-preview has a relatively high pre-mitigation dollar extraction rate suggests it may be particularly susceptible to this type of attack without intervention. The data highlights the importance of ongoing security assessments and tailored mitigation strategies for each model to protect against malicious exploitation.