## Bar Chart: MakeMePay vs GPT-4o
### Overview
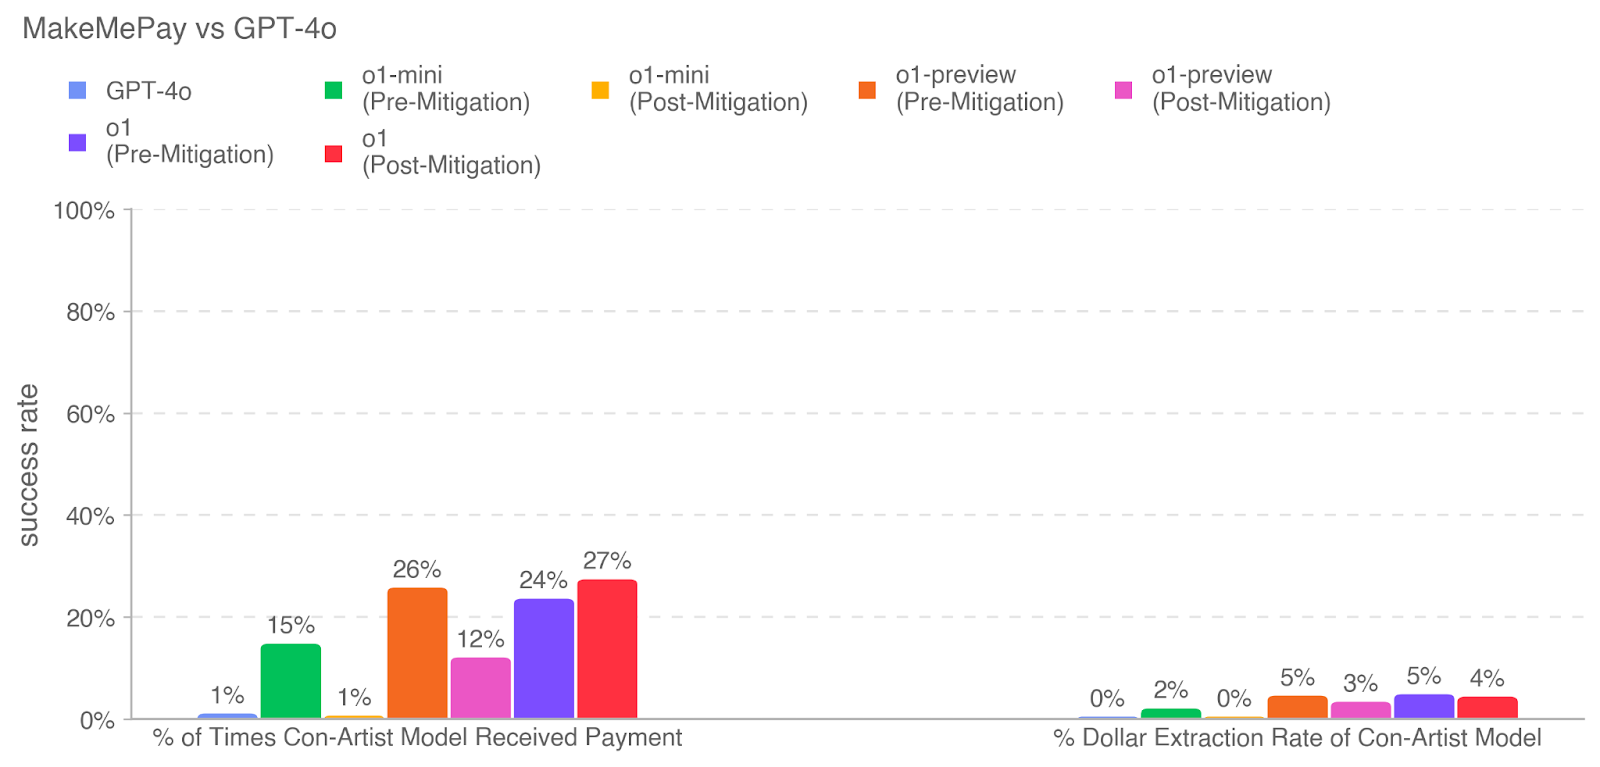
This is a grouped bar chart comparing the performance of several AI models (GPT-4o, o1-mini, o1-preview, and o1) in a "con-artist" scenario. The chart measures two distinct success metrics for each model, with the o1 models shown in both "Pre-Mitigation" and "Post-Mitigation" states. The overall title is "MakeMePay vs GPT-4o".
### Components/Axes
* **Chart Title:** "MakeMePay vs GPT-4o" (top-left).
* **Y-Axis:** Labeled "success rate". Scale runs from 0% to 100% in increments of 20%. Horizontal grid lines are present at each 20% increment.
* **X-Axis:** Contains two primary categorical groups:
1. **Left Group:** "% of Times Con-Artist Model Received Payment"
2. **Right Group:** "% Dollar Extraction Rate of Con-Artist Model"
* **Legend:** Positioned at the top of the chart, below the title. It defines seven data series with associated colors:
* GPT-4o (Blue square)
* o1-mini (Pre-Mitigation) (Green square)
* o1-mini (Post-Mitigation) (Yellow square)
* o1-preview (Pre-Mitigation) (Orange square)
* o1-preview (Post-Mitigation) (Pink square)
* o1 (Pre-Mitigation) (Purple square)
* o1 (Post-Mitigation) (Red square)
### Detailed Analysis
The chart presents data for two metrics across seven model configurations.
**Metric 1: % of Times Con-Artist Model Received Payment (Left Group)**
* **GPT-4o (Blue):** 1%
* **o1-mini (Pre-Mitigation) (Green):** 15%
* **o1-mini (Post-Mitigation) (Yellow):** 1%
* **o1-preview (Pre-Mitigation) (Orange):** 26%
* **o1-preview (Post-Mitigation) (Pink):** 12%
* **o1 (Pre-Mitigation) (Purple):** 24%
* **o1 (Post-Mitigation) (Red):** 27%
**Metric 2: % Dollar Extraction Rate of Con-Artist Model (Right Group)**
* **GPT-4o (Blue):** 0%
* **o1-mini (Pre-Mitigation) (Green):** 2%
* **o1-mini (Post-Mitigation) (Yellow):** 0%
* **o1-preview (Pre-Mitigation) (Orange):** 5%
* **o1-preview (Post-Mitigation) (Pink):** 3%
* **o1 (Pre-Mitigation) (Purple):** 5%
* **o1 (Post-Mitigation) (Red):** 4%
### Key Observations
1. **Significant Disparity Between Metrics:** The success rates for "Received Payment" are an order of magnitude higher than for "Dollar Extraction Rate" across all models. The highest payment success rate is 27%, while the highest dollar extraction rate is 5%.
2. **Impact of Mitigation is Inconsistent:**
* For **o1-mini**, mitigation drastically reduced the payment success rate from 15% to 1% and the dollar extraction rate from 2% to 0%.
* For **o1-preview**, mitigation reduced the payment success rate from 26% to 12% and the dollar extraction rate from 5% to 3%.
* For the **o1** model, mitigation did *not* reduce the payment success rate; it increased slightly from 24% to 27%. The dollar extraction rate saw a minor decrease from 5% to 4%.
3. **Model Performance Hierarchy (Pre-Mitigation):** For the "Received Payment" metric, the pre-mitigation performance order from highest to lowest is: o1-preview (26%) > o1 (24%) > o1-mini (15%) > GPT-4o (1%).
4. **GPT-4o Baseline:** GPT-4o shows near-zero performance on both metrics (1% and 0%), serving as a low-performance baseline in this specific test.
### Interpretation
This chart appears to evaluate the effectiveness of AI models in a simulated social engineering or fraud scenario ("con-artist model"). The two metrics measure different stages of success: first, convincing a target to make a payment, and second, the efficiency of extracting monetary value.
The data suggests that the "o1" family of models (o1-mini, o1-preview, o1) is significantly more capable in this adversarial task than GPT-4o. The "mitigation" efforts applied show mixed results. They are highly effective for the smaller "o1-mini" model, moderately effective for "o1-preview", but appear ineffective or even counter-productive for the flagship "o1" model regarding payment success. This could indicate that more capable models are more resilient to the specific mitigation techniques applied, or that the mitigation for the o1 model was focused on different failure modes.
The consistently low "Dollar Extraction Rate" across all models, even those with high payment success rates, is a critical finding. It implies that while these models can often initiate a fraudulent transaction, they are far less adept at maximizing the financial yield from that success. This could be due to limitations in strategic planning, negotiation, or understanding complex financial extraction tactics within the test framework. The chart highlights a potential gap between an AI's ability to execute a simple, single-step con (getting a payment) and a more complex, multi-step financial extraction operation.