## Line Charts: Encoding Performance Comparison
### Overview
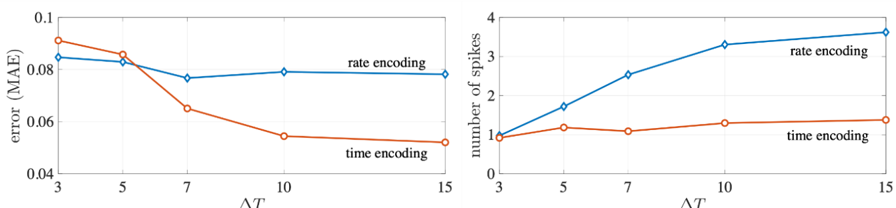
The image contains two line charts comparing the performance of rate encoding and time encoding methods. The left chart shows the error (MAE - Mean Absolute Error) as a function of ΔT, while the right chart shows the number of spikes as a function of ΔT.
### Components/Axes
**Left Chart:**
* **Title:** error (MAE)
* **Y-axis:** error (MAE), ranging from 0.04 to 0.1.
* **X-axis:** ΔT, with values 3, 5, 7, 10, and 15.
* **Data Series:**
* Rate encoding (blue line with diamond markers)
* Time encoding (orange line with circle markers)
**Right Chart:**
* **Title:** number of spikes
* **Y-axis:** number of spikes, ranging from 0 to 4.
* **X-axis:** ΔT, with values 3, 5, 7, 10, and 15.
* **Data Series:**
* Rate encoding (blue line with diamond markers)
* Time encoding (orange line with circle markers)
### Detailed Analysis
**Left Chart (Error vs. ΔT):**
* **Rate Encoding (blue):** The error starts at approximately 0.085 at ΔT = 3, decreases slightly to approximately 0.082 at ΔT = 5, then decreases further to approximately 0.077 at ΔT = 7, and remains relatively constant at approximately 0.078 at ΔT = 10 and ΔT = 15.
* **Time Encoding (orange):** The error starts at approximately 0.09 at ΔT = 3, decreases to approximately 0.082 at ΔT = 5, then decreases significantly to approximately 0.064 at ΔT = 7, and continues to decrease to approximately 0.052 at ΔT = 10 and remains relatively constant at approximately 0.05 at ΔT = 15.
**Right Chart (Number of Spikes vs. ΔT):**
* **Rate Encoding (blue):** The number of spikes increases from approximately 1.2 at ΔT = 3 to approximately 2.7 at ΔT = 7, and continues to increase to approximately 3.7 at ΔT = 15.
* **Time Encoding (orange):** The number of spikes remains relatively constant at approximately 1.0 at ΔT = 3, approximately 1.1 at ΔT = 5, approximately 1.1 at ΔT = 7, approximately 1.2 at ΔT = 10, and approximately 1.3 at ΔT = 15.
### Key Observations
* In the left chart, the error for time encoding decreases more significantly with increasing ΔT compared to rate encoding.
* In the right chart, the number of spikes for rate encoding increases significantly with increasing ΔT, while the number of spikes for time encoding remains relatively constant.
### Interpretation
The data suggests that time encoding is more effective in reducing error (MAE) as ΔT increases, while rate encoding requires a higher number of spikes to achieve similar or slightly higher error rates. The relationship between ΔT and the number of spikes differs significantly between the two encoding methods. Rate encoding's performance seems to improve with more spikes (higher ΔT), while time encoding maintains a relatively stable number of spikes and achieves lower error rates at higher ΔT values. This could indicate that time encoding is more efficient in terms of spike usage for the same level of accuracy, especially as ΔT increases.