## Line Chart: Encoding Performance vs. Time Steps
### Overview
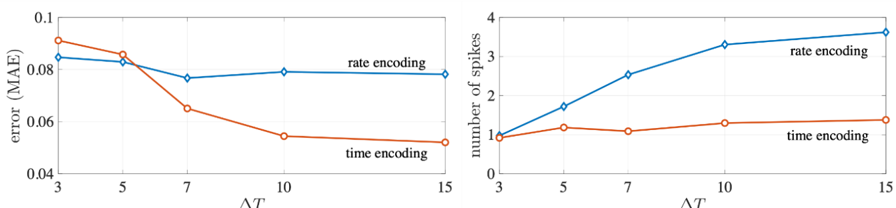
The image presents two line charts side-by-side, comparing the performance of "rate encoding" and "time encoding" methods. The left chart displays the Mean Absolute Error (MAE) as a function of the number of time steps (NT), while the right chart shows the number of spikes as a function of NT. Both charts cover the range of NT from 3 to 15.
### Components/Axes
* **Left Chart:**
* X-axis: NT (Number of Time Steps), ranging from 3 to 15.
* Y-axis: error (MAE), ranging from 0.04 to 0.1.
* Data Series:
* "rate encoding" (Blue line with diamond markers)
* "time encoding" (Orange line with circle markers)
* **Right Chart:**
* X-axis: NT (Number of Time Steps), ranging from 3 to 15.
* Y-axis: number of spikes, ranging from 0 to 4.
* Data Series:
* "rate encoding" (Blue line with diamond markers)
* "time encoding" (Orange line with circle markers)
### Detailed Analysis or Content Details
**Left Chart (MAE vs. NT):**
* **rate encoding (Blue):** The line starts at approximately 0.092 at NT=3, decreases to approximately 0.076 at NT=5, then decreases to approximately 0.071 at NT=7, increases slightly to approximately 0.073 at NT=10, and finally decreases to approximately 0.072 at NT=15. The trend is generally decreasing, with some fluctuations.
* **time encoding (Orange):** The line starts at approximately 0.095 at NT=3, decreases steadily to approximately 0.062 at NT=7, and then decreases further to approximately 0.055 at NT=15. The trend is consistently decreasing.
**Right Chart (Number of Spikes vs. NT):**
* **rate encoding (Blue):** The line starts at approximately 0.8 at NT=3, increases to approximately 1.6 at NT=5, increases to approximately 2.4 at NT=7, increases to approximately 3.2 at NT=10, and finally increases to approximately 3.6 at NT=15. The trend is consistently increasing.
* **time encoding (Orange):** The line starts at approximately 1.0 at NT=3, increases to approximately 1.4 at NT=5, increases to approximately 1.7 at NT=7, increases to approximately 1.9 at NT=10, and finally increases to approximately 2.1 at NT=15. The trend is consistently increasing, but at a slower rate than "rate encoding".
### Key Observations
* In the left chart, "time encoding" consistently achieves lower MAE values than "rate encoding" across all values of NT.
* In the right chart, both encoding methods show an increasing number of spikes with increasing NT. "rate encoding" exhibits a steeper increase in the number of spikes compared to "time encoding".
* The MAE for "time encoding" decreases more rapidly initially (between NT=3 and NT=7) than in the later stages.
* The number of spikes for "rate encoding" is consistently higher than for "time encoding".
### Interpretation
The data suggests that "time encoding" is a more accurate method than "rate encoding" for the given task, as evidenced by the lower MAE values. However, "rate encoding" requires a larger number of spikes to achieve its performance. This implies a trade-off between accuracy and computational cost (or energy consumption, if spikes represent neuronal firings).
The decreasing MAE for "time encoding" with increasing NT suggests that the performance of this method improves as more time steps are considered. The increasing number of spikes with NT for both methods indicates that more information is being processed as the temporal window expands. The difference in the rate of increase in spikes between the two methods could be related to how each method represents information over time. "Rate encoding" may rely on a higher density of spikes to convey information, while "time encoding" may be more efficient in its use of spikes.
The charts provide a quantitative comparison of two encoding strategies, highlighting their respective strengths and weaknesses. This information could be valuable for selecting the most appropriate encoding method for a specific application, considering factors such as accuracy requirements, computational resources, and energy constraints.