## Chart: Jensen-Shannon Divergence vs. Accuracy
### Overview
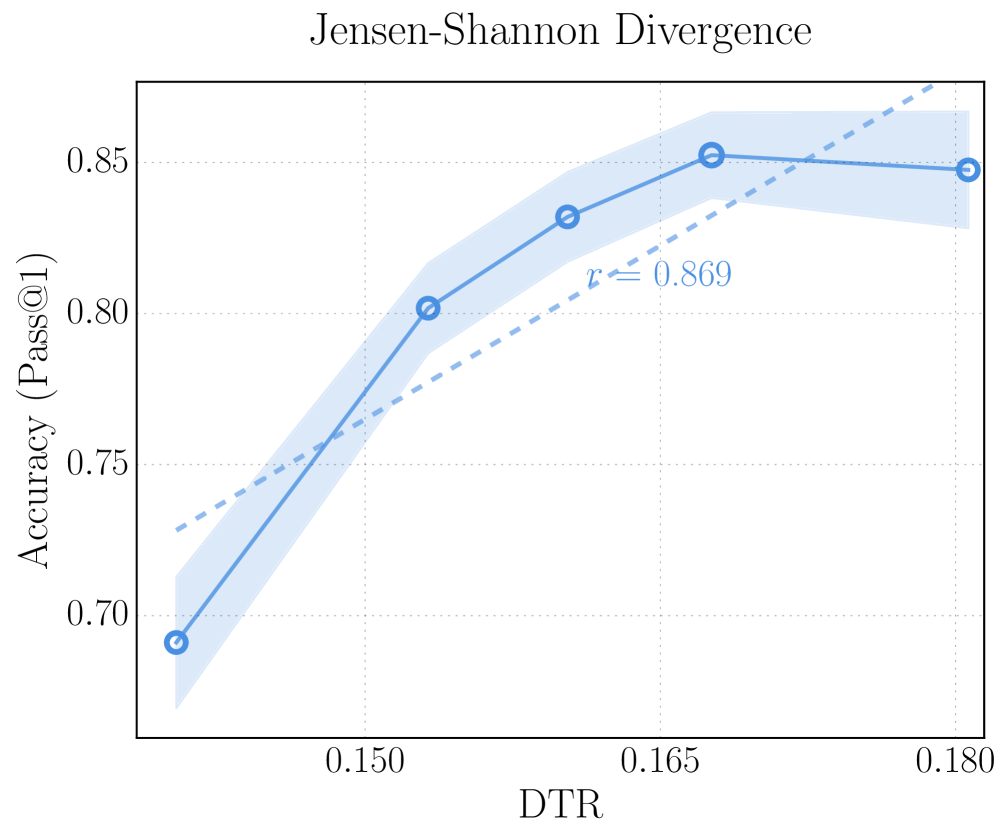
The image is a line chart showing the relationship between Jensen-Shannon Divergence (DTR) and Accuracy (Pass@1). The chart includes a solid blue line representing the accuracy trend, a shaded blue area indicating uncertainty, and a dashed blue line representing a linear fit.
### Components/Axes
* **Title:** Jensen-Shannon Divergence
* **X-axis:** DTR (Domain Transfer Ratio)
* Scale: 0.150, 0.165, 0.180
* **Y-axis:** Accuracy (Pass@1)
* Scale: 0.70, 0.75, 0.80, 0.85
* **Data Series:**
* Accuracy (Pass@1) - Solid blue line with shaded uncertainty area.
* Linear Fit - Dashed blue line.
* **Annotation:** r ≈ 0.869 (located near the dashed blue line)
### Detailed Analysis
* **Accuracy (Pass@1) Trend:** The solid blue line shows an upward trend initially, then plateaus and slightly decreases.
* At DTR = 0.140 (estimated), Accuracy ≈ 0.69
* At DTR = 0.150, Accuracy ≈ 0.80
* At DTR = 0.165, Accuracy ≈ 0.83
* At DTR = 0.180, Accuracy ≈ 0.85
* **Linear Fit Trend:** The dashed blue line shows a consistent upward trend.
* At DTR = 0.140 (estimated), Linear Fit ≈ 0.73
* At DTR = 0.180, Linear Fit ≈ 0.87
* **Uncertainty:** The shaded blue area around the solid blue line represents the uncertainty in the accuracy measurements. The uncertainty appears to increase as DTR increases.
### Key Observations
* The accuracy increases sharply between DTR values of 0.140 and 0.150, then the rate of increase slows down.
* The linear fit (dashed line) does not perfectly match the accuracy trend, especially at higher DTR values where the accuracy plateaus.
* The annotation "r ≈ 0.869" likely represents the correlation coefficient between DTR and Accuracy, indicating a strong positive correlation.
### Interpretation
The chart suggests that there is a positive relationship between Jensen-Shannon Divergence (DTR) and Accuracy (Pass@1), but the relationship is not perfectly linear. Initially, increasing the DTR leads to a significant improvement in accuracy. However, beyond a certain point (around DTR = 0.165), further increases in DTR do not result in substantial gains in accuracy, and the accuracy even appears to slightly decrease. The uncertainty in the accuracy measurements also increases with DTR, suggesting that the relationship becomes less predictable at higher DTR values. The linear fit provides a general approximation of the relationship, but it does not capture the plateauing effect observed in the accuracy trend.