\n
## Line Chart: Jensen-Shannon Divergence
### Overview
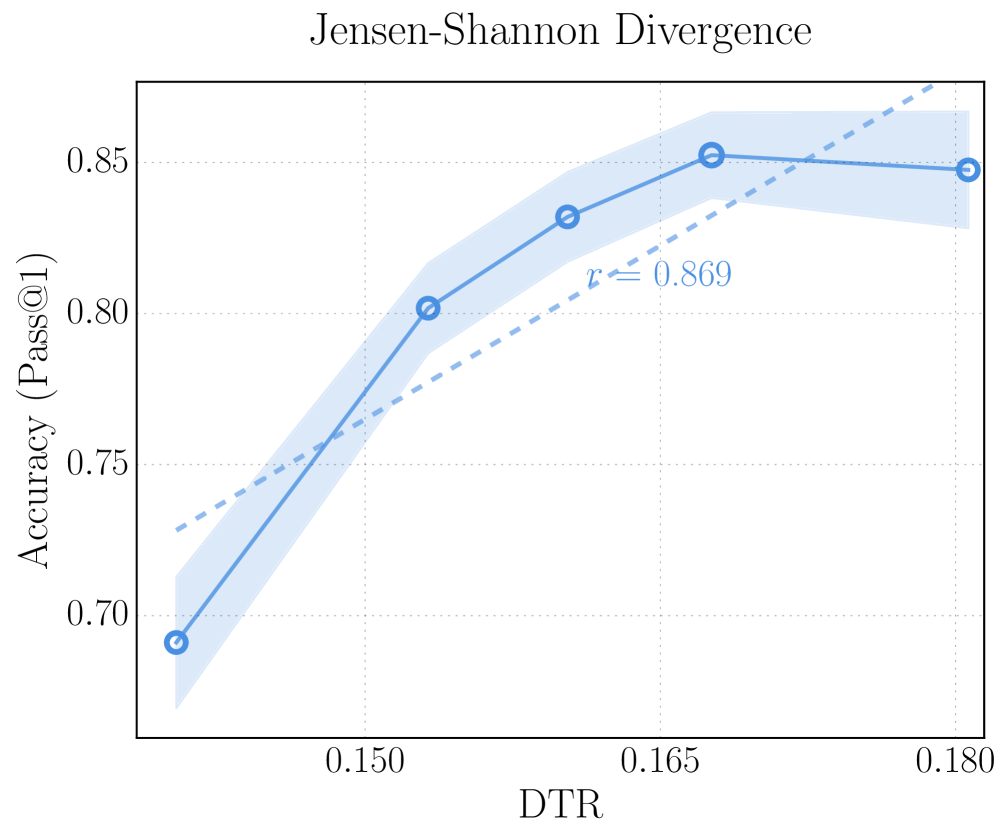
This image presents a line chart illustrating the relationship between DTR (likely a measure of data transformation rate) and Accuracy (Pass@1). The chart displays two lines, one solid and one dashed, both with shaded regions representing confidence intervals. A Pearson correlation coefficient (r) is also indicated on the chart.
### Components/Axes
* **Title:** Jensen-Shannon Divergence
* **X-axis:** DTR (ranging approximately from 0.145 to 0.180)
* **Y-axis:** Accuracy (Pass@1) (ranging approximately from 0.68 to 0.86)
* **Line 1 (Solid Blue):** Represents the primary data series.
* **Line 2 (Dashed Blue):** Represents a secondary data series.
* **Shaded Region:** Represents the confidence interval around each line.
* **Data Points:** Circles mark specific data points along each line.
* **Correlation Coefficient:** r = 0.869
### Detailed Analysis
The solid blue line shows an upward trend, starting at approximately 0.70 accuracy at a DTR of 0.145. It rises to approximately 0.83 accuracy at a DTR of 0.165, and then plateaus, reaching approximately 0.85 accuracy at a DTR of 0.180. The confidence interval around this line is relatively wide at lower DTR values and narrows as DTR increases.
The dashed blue line also exhibits an upward trend, but it starts at a slightly lower accuracy of approximately 0.68 at a DTR of 0.145. It rises more steeply than the solid line, reaching approximately 0.81 accuracy at a DTR of 0.165, and then also plateaus, reaching approximately 0.85 accuracy at a DTR of 0.180. The confidence interval around this line is also wide at lower DTR values and narrows as DTR increases.
Specific data points (approximated from the chart):
* **Solid Line:**
* DTR = 0.145, Accuracy ≈ 0.70
* DTR = 0.155, Accuracy ≈ 0.78
* DTR = 0.165, Accuracy ≈ 0.83
* DTR = 0.180, Accuracy ≈ 0.85
* **Dashed Line:**
* DTR = 0.145, Accuracy ≈ 0.68
* DTR = 0.155, Accuracy ≈ 0.76
* DTR = 0.165, Accuracy ≈ 0.81
* DTR = 0.180, Accuracy ≈ 0.85
### Key Observations
* Both data series demonstrate a positive correlation between DTR and Accuracy. As DTR increases, Accuracy generally increases.
* The dashed line initially shows lower accuracy than the solid line, but both lines converge at higher DTR values.
* The confidence intervals suggest a degree of uncertainty in the accuracy measurements, particularly at lower DTR values.
* The Pearson correlation coefficient of 0.869 indicates a strong positive linear correlation between the two data series.
### Interpretation
The chart suggests that increasing the DTR generally improves the Accuracy (Pass@1) of the system being evaluated. The convergence of the two lines at higher DTR values could indicate that the effect of the specific transformation represented by the dashed line diminishes as DTR increases, or that the two transformations become more similar in their impact. The strong positive correlation (r = 0.869) confirms a robust relationship between DTR and Accuracy. The Jensen-Shannon Divergence, as the chart title suggests, is likely being used to measure the similarity between two probability distributions, and the chart demonstrates how this divergence relates to the system's performance (Accuracy). The confidence intervals provide a measure of the variability in the accuracy measurements, which is important for assessing the reliability of the results. The plateauing of both lines at higher DTR values suggests there may be a point of diminishing returns, where further increases in DTR do not lead to significant improvements in accuracy.