## Line Chart: Jensen-Shannon Divergence
### Overview
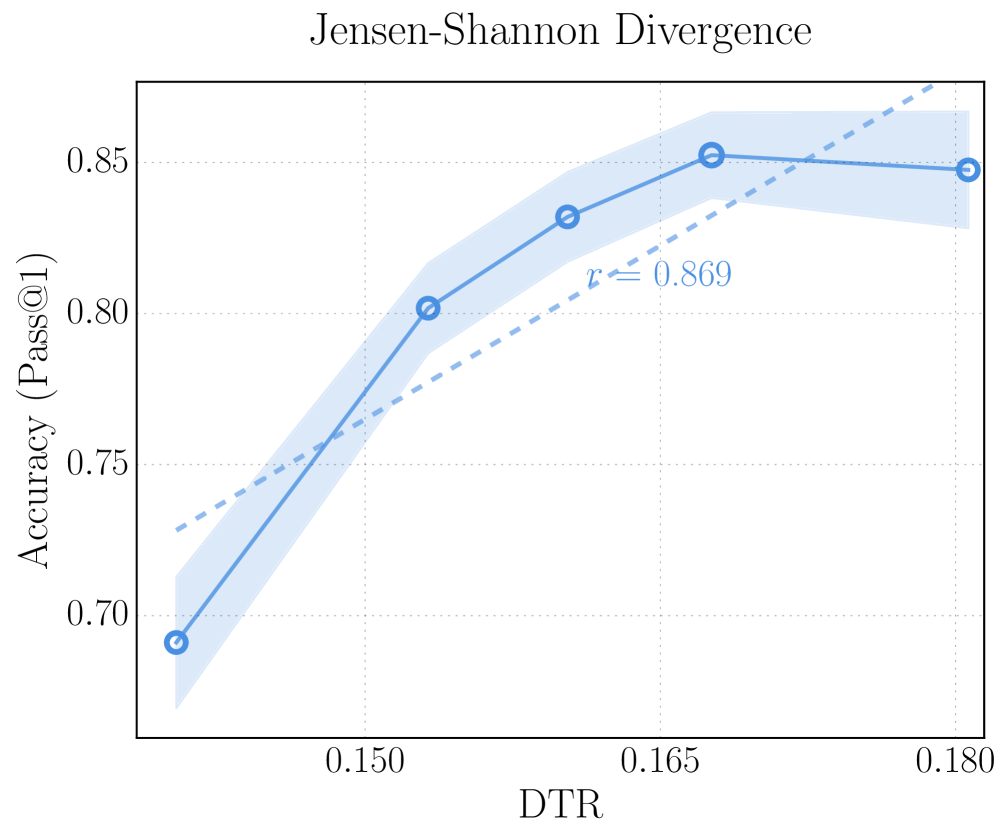
The chart illustrates the relationship between DTR (x-axis) and Accuracy (Pass@1) (y-axis) using a blue line with markers and a shaded confidence interval. A dashed reference line labeled "r = 0.869" is included for comparison.
### Components/Axes
- **X-axis (DTR)**: Ranges from 0.15 to 0.18 in increments of 0.01. Labels: 0.15, 0.16, 0.17, 0.18.
- **Y-axis (Accuracy (Pass@1))**: Ranges from 0.70 to 0.85 in increments of 0.01. Labels: 0.70, 0.75, 0.80, 0.85.
- **Legend**: Not explicitly labeled, but two distinct lines are present:
- **Blue solid line**: Represents the primary data series.
- **Dashed line**: Represents a reference line (r = 0.869).
### Detailed Analysis
- **Data Points**:
- At DTR = 0.15: Accuracy = 0.70 (blue marker).
- At DTR = 0.16: Accuracy = 0.80 (blue marker).
- At DTR = 0.17: Accuracy = 0.85 (blue marker).
- At DTR = 0.18: Accuracy = 0.85 (blue marker).
- **Trends**:
- The blue line slopes upward, indicating increasing accuracy with higher DTR values.
- The dashed line (r = 0.869) is a diagonal reference, suggesting a strong positive correlation between DTR and accuracy.
- The shaded area around the blue line represents variability or confidence intervals, widening slightly as DTR increases.
### Key Observations
- Accuracy improves significantly from 0.70 (DTR = 0.15) to 0.85 (DTR = 0.17–0.18).
- The highest accuracy (0.85) is observed at DTR = 0.17 and 0.18, with a slight plateau.
- The shaded region indicates uncertainty, with the widest spread between DTR = 0.15 and 0.16.
### Interpretation
The chart demonstrates a strong positive correlation (r = 0.869) between DTR and accuracy in the Jensen-Shannon Divergence metric. As DTR increases, accuracy consistently rises, peaking at DTR = 0.17–0.18. The shaded confidence interval suggests variability in the data, particularly at lower DTR values. This implies that optimizing DTR could be a critical factor in improving performance, though the plateau at higher DTR values may indicate diminishing returns or a saturation point. The dashed reference line reinforces the linear relationship, emphasizing the reliability of the trend.