## Bar Charts: Qwen2.5-7B-Instruct Performance
### Overview
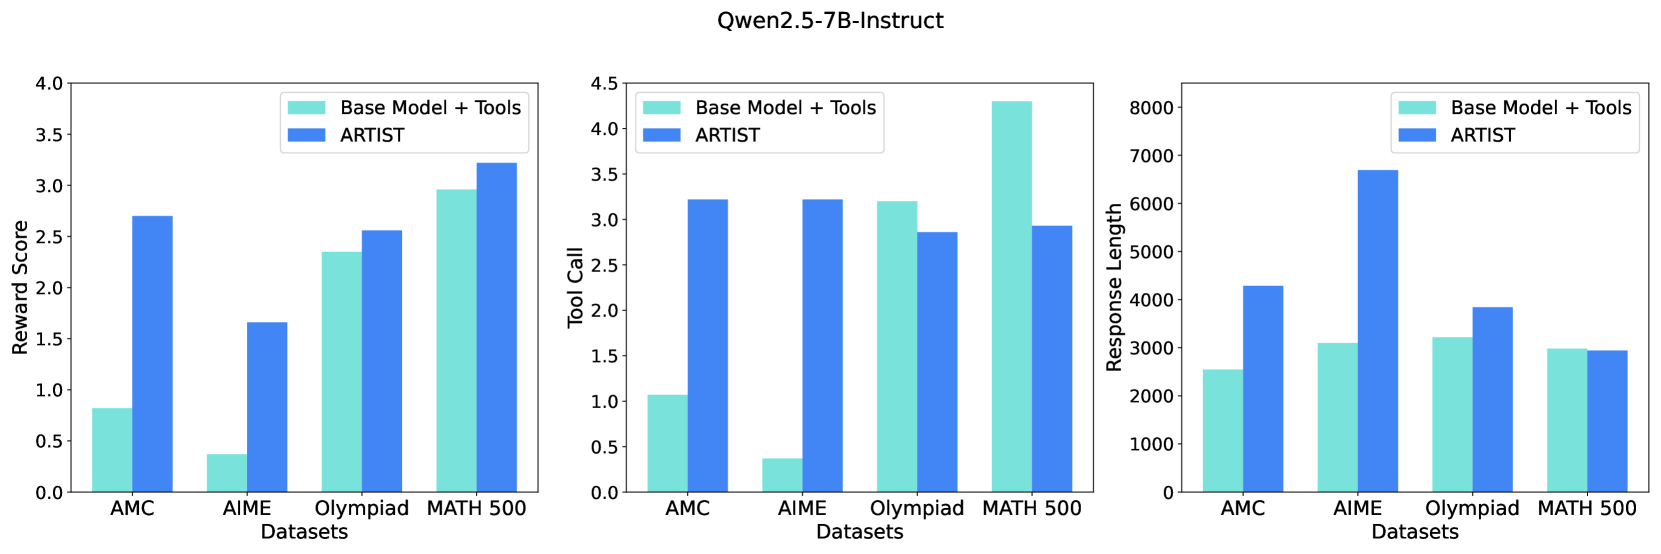
The image contains three bar charts comparing the performance of two models, "Base Model + Tools" and "ARTIST," across four datasets: AMC, AIME, Olympiad, and MATH 500. The charts measure "Reward Score," "Tool Call," and "Response Length."
### Components/Axes
**Overall Structure:**
* **Title:** Qwen2.5-7B-Instruct (located at the top-center of the image)
* Three bar charts arranged horizontally.
**Chart 1: Reward Score**
* **Y-axis:** Reward Score, ranging from 0.0 to 4.0 in increments of 0.5.
* **X-axis:** Datasets: AMC, AIME, Olympiad, MATH 500.
* **Legend:** Located at the top-right of the chart.
* Base Model + Tools (light blue)
* ARTIST (dark blue)
**Chart 2: Tool Call**
* **Y-axis:** Tool Call, ranging from 0.0 to 4.5 in increments of 0.5.
* **X-axis:** Datasets: AMC, AIME, Olympiad, MATH 500.
* **Legend:** Located at the top-left of the chart.
* Base Model + Tools (light blue)
* ARTIST (dark blue)
**Chart 3: Response Length**
* **Y-axis:** Response Length, ranging from 0 to 8000 in increments of 1000.
* **X-axis:** Datasets: AMC, AIME, Olympiad, MATH 500.
* **Legend:** Located at the top-right of the chart.
* Base Model + Tools (light blue)
* ARTIST (dark blue)
### Detailed Analysis
**Chart 1: Reward Score**
* **AMC:**
* Base Model + Tools: ~0.8
* ARTIST: ~2.7
* **AIME:**
* Base Model + Tools: ~0.4
* ARTIST: ~1.7
* **Olympiad:**
* Base Model + Tools: ~2.4
* ARTIST: ~2.6
* **MATH 500:**
* Base Model + Tools: ~3.0
* ARTIST: ~3.2
**Trend:** The ARTIST model consistently achieves a higher reward score than the Base Model + Tools across all datasets.
**Chart 2: Tool Call**
* **AMC:**
* Base Model + Tools: ~1.1
* ARTIST: ~3.2
* **AIME:**
* Base Model + Tools: ~0.4
* ARTIST: ~3.2
* **Olympiad:**
* Base Model + Tools: ~3.2
* ARTIST: ~2.9
* **MATH 500:**
* Base Model + Tools: ~4.3
* ARTIST: ~2.9
**Trend:** The ARTIST model generally has a higher tool call count for AMC and AIME, but a lower tool call count for Olympiad and MATH 500 compared to the Base Model + Tools.
**Chart 3: Response Length**
* **AMC:**
* Base Model + Tools: ~2600
* ARTIST: ~4300
* **AIME:**
* Base Model + Tools: ~3100
* ARTIST: ~6700
* **Olympiad:**
* Base Model + Tools: ~3800
* ARTIST: ~3200
* **MATH 500:**
* Base Model + Tools: ~3100
* ARTIST: ~3100
**Trend:** The ARTIST model produces longer responses for AMC and AIME, but shorter or similar length responses for Olympiad and MATH 500 compared to the Base Model + Tools.
### Key Observations
* The ARTIST model consistently outperforms the Base Model + Tools in terms of reward score across all datasets.
* The ARTIST model uses more tools for AMC and AIME, but fewer for Olympiad and MATH 500.
* The ARTIST model generates longer responses for AMC and AIME, but shorter or similar length responses for Olympiad and MATH 500.
### Interpretation
The data suggests that the ARTIST model is more effective at solving problems in the given datasets, as indicated by the higher reward scores. The varying tool call and response length patterns suggest that the ARTIST model employs different strategies depending on the dataset. For AMC and AIME, it uses more tools and generates longer responses, possibly indicating a more complex problem-solving approach. For Olympiad and MATH 500, it uses fewer tools and generates shorter responses, suggesting a more efficient or direct approach. The "Base Model + Tools" seems to rely more on tools for Olympiad and MATH 500, while ARTIST seems to perform better without as many tool calls.