## Bar Charts: Performance Comparison of Base Model + Tools vs. ARTIST on Mathematical Datasets
### Overview
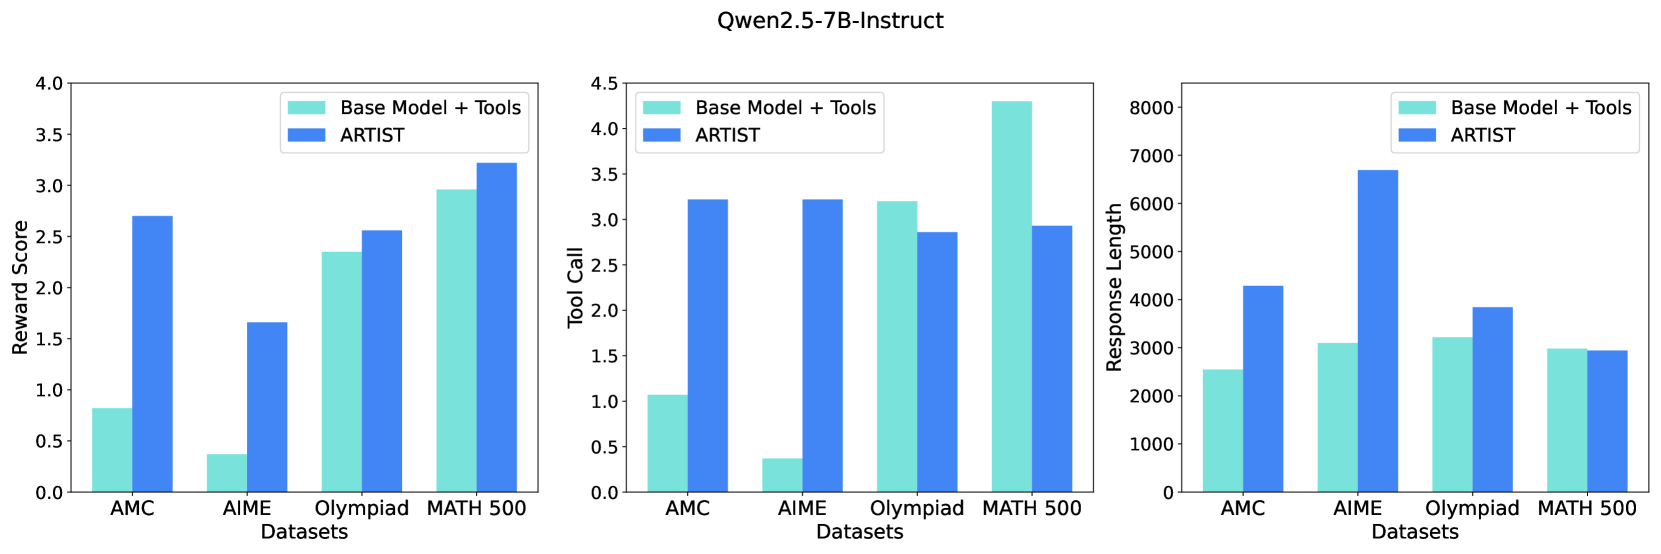
The image displays three grouped bar charts under the main title "Qwen2.5-7B-Instruct". The charts compare the performance of two systems—"Base Model + Tools" and "ARTIST"—across four mathematical reasoning datasets: AMC, AIME, Olympiad, and MATH 500. The comparison is made across three metrics: Reward Score, Tool Call count, and Response Length.
### Components/Axes
* **Main Title:** "Qwen2.5-7B-Instruct" (centered at the top).
* **Legend:** Present in the top-right corner of each subplot.
* Light Turquoise Bar: "Base Model + Tools"
* Blue Bar: "ARTIST"
* **X-Axis (Common to all charts):** Labeled "Datasets". Categories from left to right: "AMC", "AIME", "Olympiad", "MATH 500".
* **Y-Axes (Individual to each chart):**
1. **Left Chart:** Labeled "Reward Score". Scale from 0.0 to 4.0, with major ticks at 0.5 intervals.
2. **Middle Chart:** Labeled "Tool Call". Scale from 0.0 to 4.5, with major ticks at 0.5 intervals.
3. **Right Chart:** Labeled "Response Length". Scale from 0 to 8000, with major ticks at 1000 intervals.
### Detailed Analysis
#### Chart 1: Reward Score (Left)
* **Trend Verification:** The blue "ARTIST" bars are consistently taller than the light turquoise "Base Model + Tools" bars for AMC, AIME, and Olympiad, indicating higher reward scores. For MATH 500, the blue bar is slightly taller.
* **Data Points (Approximate):**
* **AMC:** Base Model ≈ 0.8, ARTIST ≈ 2.7
* **AIME:** Base Model ≈ 0.4, ARTIST ≈ 1.7
* **Olympiad:** Base Model ≈ 2.35, ARTIST ≈ 2.55
* **MATH 500:** Base Model ≈ 2.95, ARTIST ≈ 3.25
#### Chart 2: Tool Call (Middle)
* **Trend Verification:** The relationship is mixed. The blue "ARTIST" bar is significantly taller for AMC and AIME. For Olympiad, the light turquoise bar is taller. For MATH 500, the light turquoise bar is dramatically taller.
* **Data Points (Approximate):**
* **AMC:** Base Model ≈ 1.1, ARTIST ≈ 3.25
* **AIME:** Base Model ≈ 0.4, ARTIST ≈ 3.25
* **Olympiad:** Base Model ≈ 3.2, ARTIST ≈ 2.85
* **MATH 500:** Base Model ≈ 4.3, ARTIST ≈ 2.95
#### Chart 3: Response Length (Right)
* **Trend Verification:** The blue "ARTIST" bars are taller for AMC, AIME, and Olympiad, indicating longer responses. For MATH 500, the bars are nearly equal, with the light turquoise bar possibly a tiny bit taller.
* **Data Points (Approximate):**
* **AMC:** Base Model ≈ 2550, ARTIST ≈ 4300
* **AIME:** Base Model ≈ 3100, ARTIST ≈ 6700
* **Olympiad:** Base Model ≈ 3200, ARTIST ≈ 3850
* **MATH 500:** Base Model ≈ 3000, ARTIST ≈ 2950
### Key Observations
1. **Reward Score Advantage:** ARTIST achieves a higher reward score than the Base Model + Tools on all four datasets, with the most dramatic relative improvement on the AIME dataset.
2. **Tool Usage Inversion:** While ARTIST uses tools much more frequently on AMC and AIME, the pattern reverses on Olympiad and especially on MATH 500, where the Base Model + Tools uses tools far more often.
3. **Response Length Correlation:** ARTIST generates substantially longer responses on AMC and AIME, which correlates with its higher tool usage and reward scores on those datasets. On MATH 500, where tool usage is lower for ARTIST, response lengths are similar between the two systems.
4. **Dataset Difficulty Gradient:** All metrics suggest the datasets vary in difficulty or nature. AMC and AIME show large performance gaps, Olympiad shows moderate gaps, and MATH 500 shows the smallest gaps, with the Base Model even leading in tool call frequency.
### Interpretation
The data suggests that the ARTIST method significantly improves the model's performance (as measured by Reward Score) on mathematical reasoning tasks compared to simply augmenting the base model with tools. However, this improvement is not achieved through a uniform increase in tool usage.
The relationship between tool calls, response length, and reward score is complex and dataset-dependent. On what are likely more challenging or procedurally intensive problems (AMC, AIME), ARTIST appears to leverage tools more aggressively and produce longer, higher-reward solutions. On other problem types (Olympiad, MATH 500), the base model with tools may rely more on brute-force tool application, while ARTIST achieves comparable or better rewards with fewer tool calls and more concise responses. This indicates ARTIST may be learning a more efficient or strategic policy for tool integration, rather than simply increasing tool frequency. The outlier is the MATH 500 dataset, where the base model's very high tool call count does not translate to a reward score advantage, hinting at potential inefficiency or misapplication of tools by the base model on that specific task distribution.