## Bar Chart: Number of Publications Over Years
### Overview
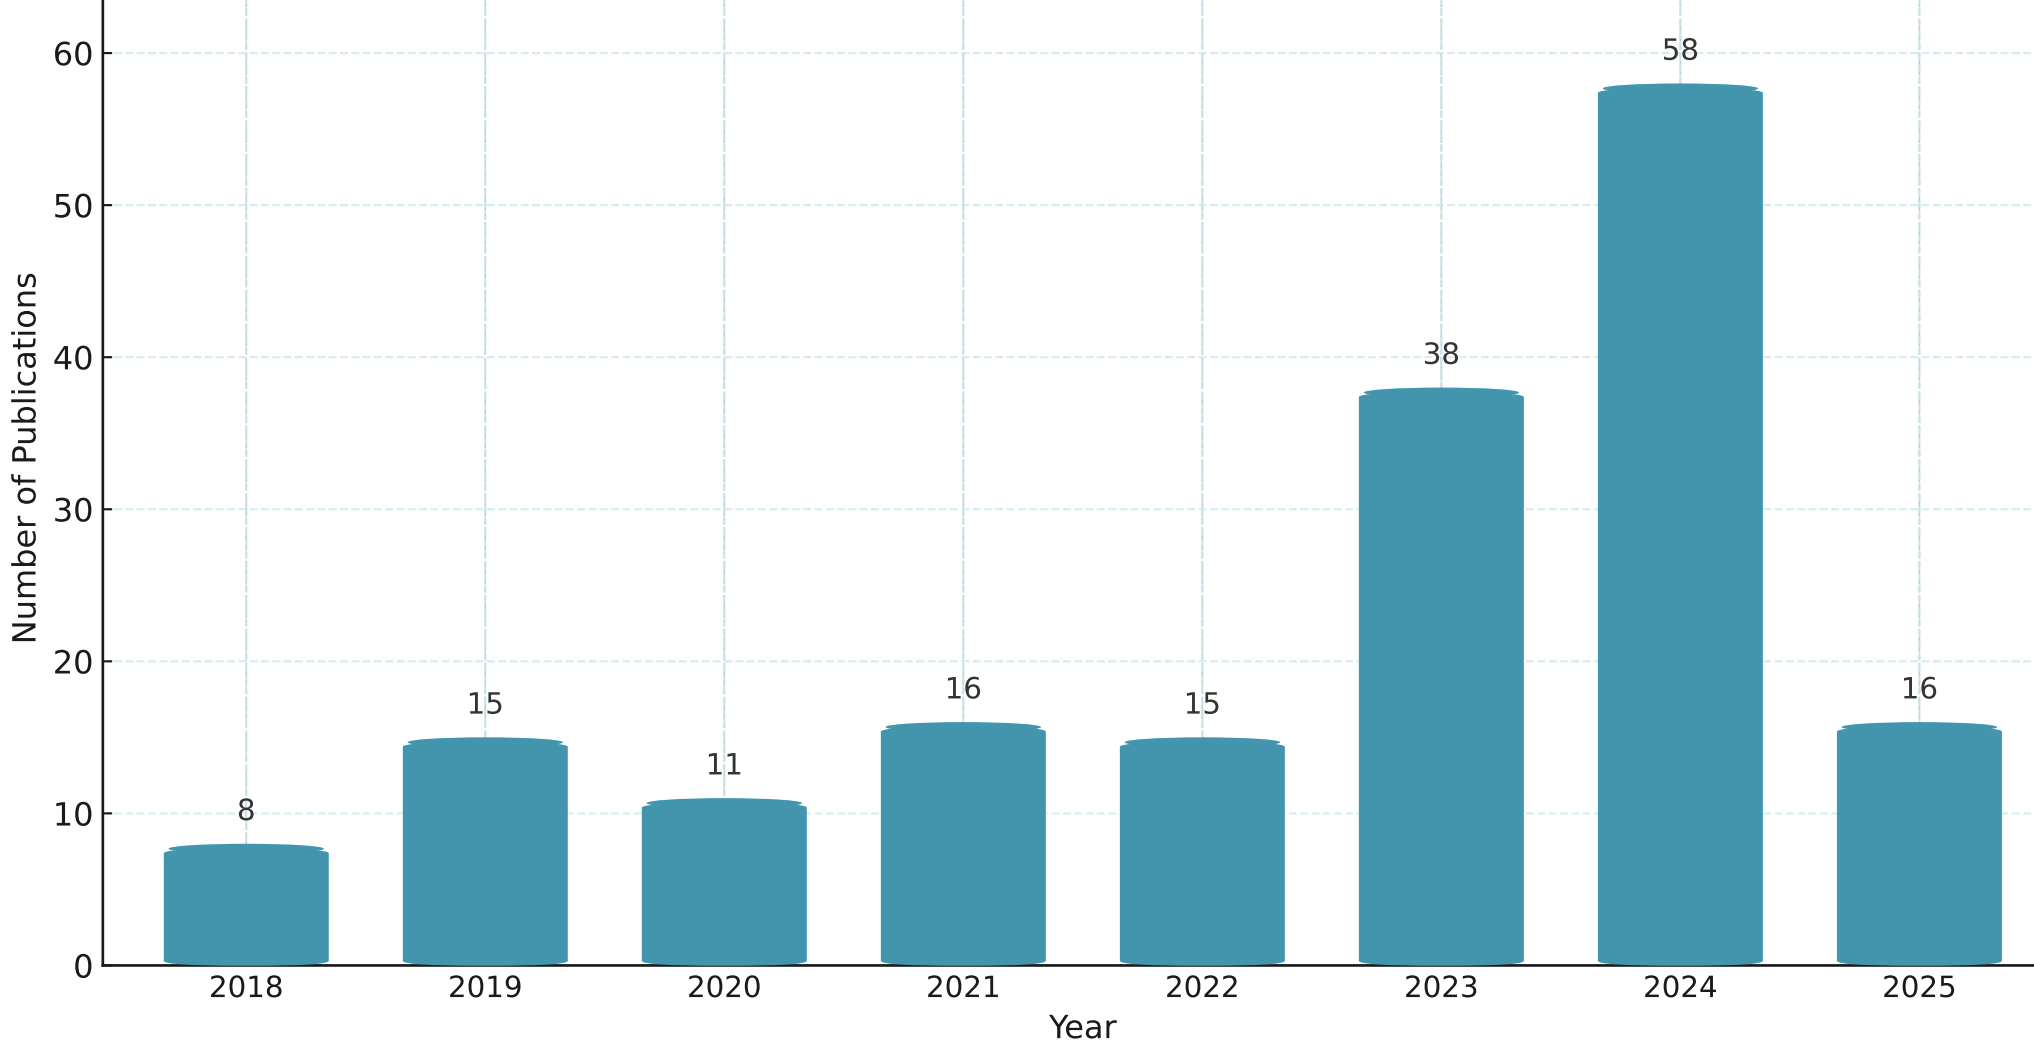
The image is a bar chart showing the number of publications over the years from 2018 to 2025. The y-axis represents the number of publications, and the x-axis represents the year. The bars are teal colored, and each bar has a value label above it.
### Components/Axes
* **X-axis:** Year, with labels for 2018, 2019, 2020, 2021, 2022, 2023, 2024, and 2025.
* **Y-axis:** Number of Publications, ranging from 0 to 60, with gridlines at intervals of 10.
* **Bars:** Teal colored bars representing the number of publications for each year.
### Detailed Analysis
Here's a breakdown of the number of publications for each year:
* **2018:** 8 publications
* **2019:** 15 publications
* **2020:** 11 publications
* **2021:** 16 publications
* **2022:** 15 publications
* **2023:** 38 publications
* **2024:** 58 publications
* **2025:** 16 publications
### Key Observations
* The number of publications increased from 2018 to 2019, then decreased in 2020.
* There was a significant increase in publications in 2023 and 2024, with 2024 having the highest number of publications.
* The number of publications decreased significantly in 2025, returning to a level similar to 2021.
### Interpretation
The bar chart illustrates the trend of publications over the years. There was a notable surge in publications in 2023 and 2024, which could be attributed to specific events, projects, or increased research activity during those years. The drop in 2025 suggests a possible shift or change in publication output. The data suggests that the years 2023 and 2024 were particularly productive in terms of publications compared to other years in the observed period.