# Technical Document Extraction: Bar Chart Analysis
## 1. Labels and Axis Titles
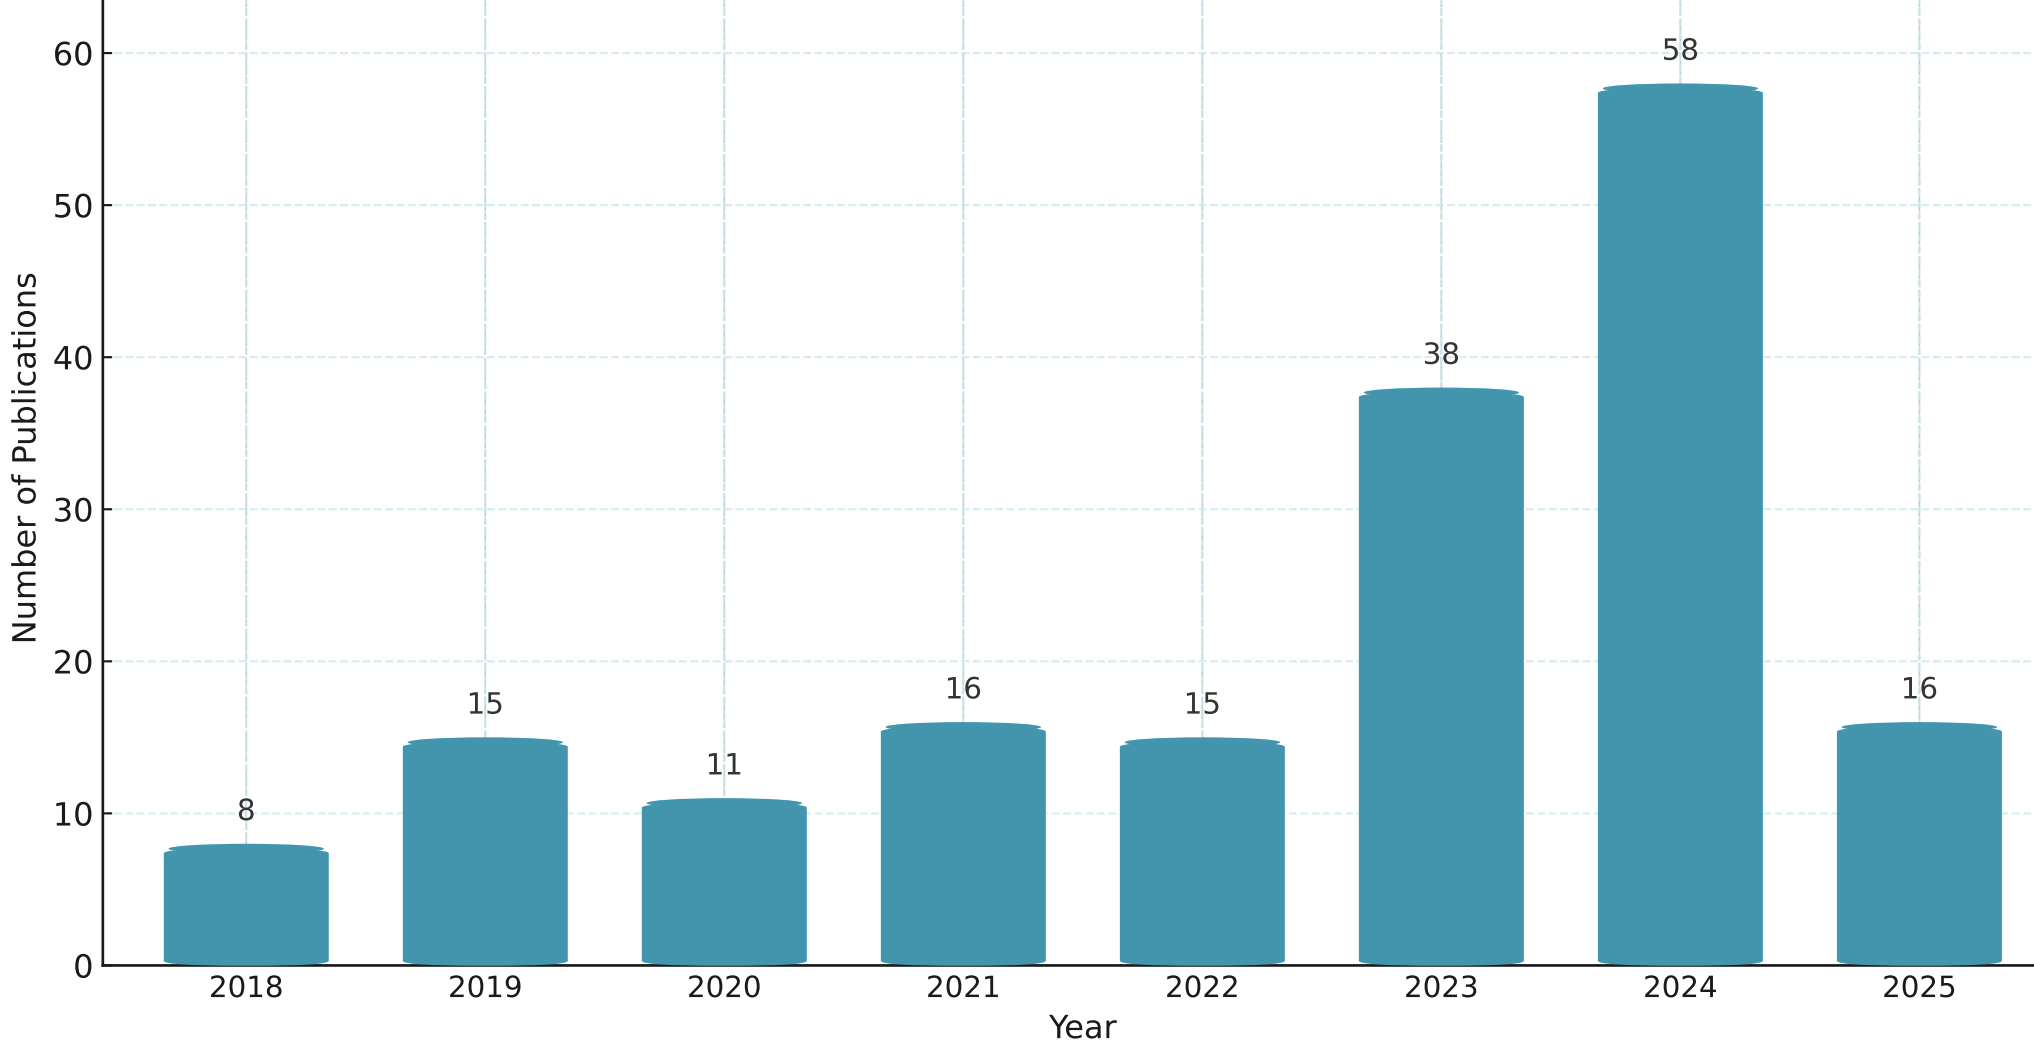
- **Y-Axis Label**: "Number of Publications"
- **X-Axis Label**: "Year"
- **Legend**: Not visible in the image.
## 2. Data Points and Categories
The chart represents annual publication counts across 8 years. Categories (years) and their corresponding values are:
| Year | Number of Publications |
|------|------------------------|
| 2018 | 8 |
| 2019 | 15 |
| 2020 | 11 |
| 2021 | 16 |
| 2022 | 15 |
| 2023 | 38 |
| 2024 | 58 |
| 2025 | 16 |
## 3. Trend Verification
- **Visual Trend**:
- The chart shows a **general upward trend** from 2018 to 2024, with a sharp increase between 2023 and 2024.
- A **significant drop** occurs in 2025, returning to the 2021 publication count (16).
- **Data Validation**:
- Values align with the visual height of bars (e.g., 2024's bar is the tallest at 58, matching the peak).
## 4. Component Isolation
### Main Chart Region
- **Bars**: Vertical bars represent annual publication counts.
- **Values**: Embedded text on top of each bar confirms numerical data.
- **Gridlines**: Light blue dashed lines for reference.
### Spatial Grounding
- **Legend Placement**: Not applicable (legend absent).
- **Bar Colors**: All bars use a consistent teal shade (no sub-categories or legends to cross-reference).
## 5. Additional Observations
- **Data Completeness**: All years from 2018 to 2025 are represented.
- **Outliers**: 2024 (58 publications) and 2025 (16 publications) show extreme fluctuations.
## 6. Language Declaration
- **Primary Language**: English (no other languages present).
## 7. Final Notes
The chart provides factual numerical data with no textual blocks or diagrams beyond the bar chart itself. All information is extracted directly from axis labels, bar heights, and embedded values.