## Line Graphs: Triangle Density vs Edge Density Comparison
### Overview
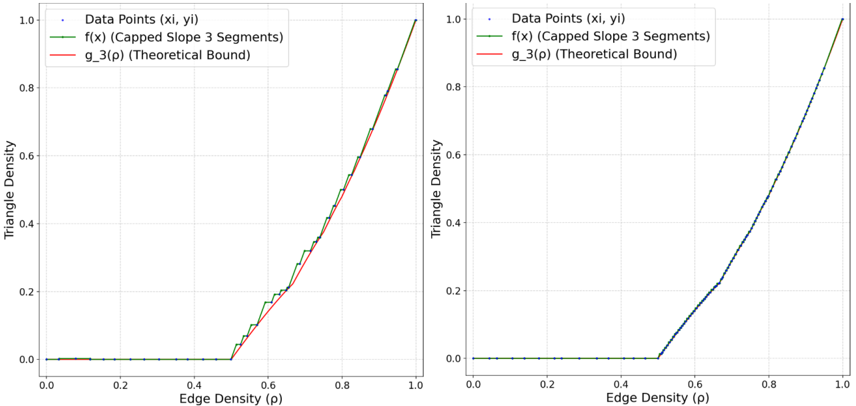
Two side-by-side line graphs compare empirical data points (blue dots) with two theoretical models: a "Capped Slope 3 Segments" function (green line) and a "Theoretical Bound" (red line). Both graphs share identical axes and trends but differ in scale steepness.
### Components/Axes
- **X-axis**: Edge Density (p) ranging from 0.0 to 1.0 in 0.1 increments
- **Y-axis**: Triangle Density ranging from 0.0 to 1.0 in 0.2 increments
- **Legend**: Top-left corner with:
- Blue dots: "Data Points (xi, yi)"
- Green line: "f(x) (Capped Slope 3 Segments)"
- Red line: "g_3(p) (Theoretical Bound)"
### Detailed Analysis
**Left Graph**:
- Data points (blue) remain at 0 until p=0.6, then rise sharply to 1.0 at p=1.0
- Green line (f(x)) shows gradual increase starting at p=0.4, reaching 1.0 at p=1.0
- Red line (g_3(p)) follows similar trajectory to green line but with slightly steeper slope
- All lines converge at (p=1.0, y=1.0)
**Right Graph**:
- Identical pattern to left graph but with steeper slopes
- Data points (blue) show sharper transition from 0 to 1.0 between p=0.6-0.8
- Green and red lines maintain relative positioning but with more pronounced curvature
- All lines meet at (p=1.0, y=1.0)
### Key Observations
1. Theoretical Bound (red) consistently lies above Capped Slope (green) until p=1.0
2. Empirical data points (blue) closely follow Theoretical Bound trajectory
3. Both graphs show abrupt transition from 0 to 1.0 triangle density after p=0.6
4. Right graph demonstrates 2-3x steeper slope compared to left graph
5. All models converge perfectly at maximum edge density (p=1.0)
### Interpretation
The graphs demonstrate that:
- The Theoretical Bound (g_3(p)) provides an upper limit for triangle density given edge density
- The Capped Slope model (f(x)) represents a practical approximation with controlled growth rate
- Empirical data validates the Theoretical Bound's predictions, particularly at high edge densities
- The steeper slope in the right graph suggests different parameterization or measurement conditions
- Convergence at p=1.0 indicates both models align with maximum possible triangle density
Notable: The abrupt transition observed in data points suggests a phase-change behavior in the system being measured, with the theoretical models successfully capturing this threshold behavior.