## CDF Chart: Rollbacks per Verification Window vs. CDF for Different Window Sizes
### Overview
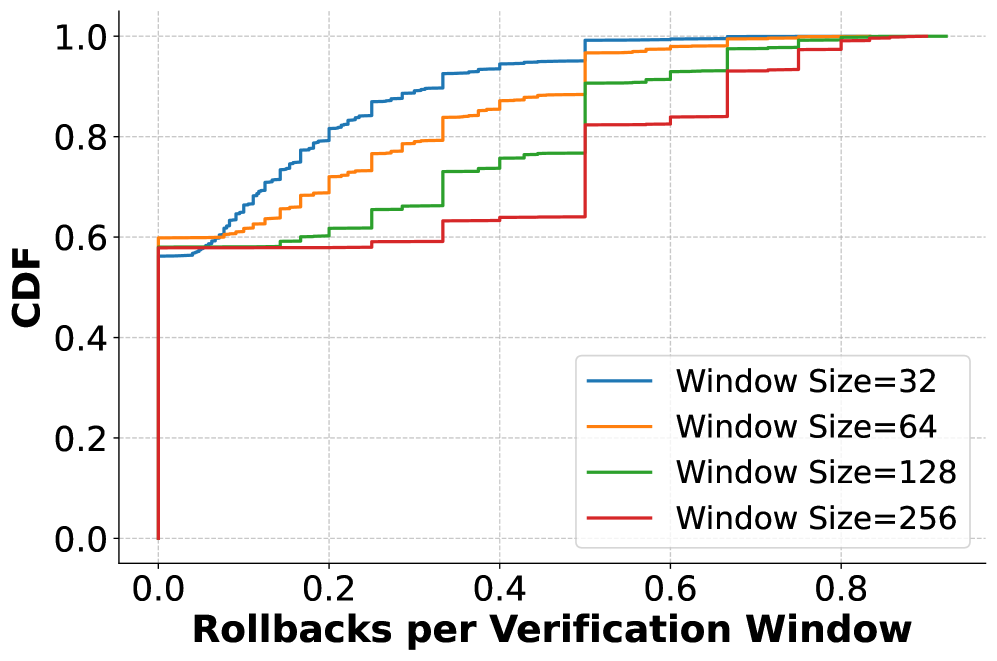
The image is a Cumulative Distribution Function (CDF) plot showing the relationship between "Rollbacks per Verification Window" and the cumulative distribution for different window sizes (32, 64, 128, and 256). The x-axis represents the number of rollbacks per verification window, and the y-axis represents the cumulative distribution function (CDF). The plot compares the CDF for different window sizes, allowing for analysis of how window size affects the distribution of rollbacks.
### Components/Axes
* **X-axis:** "Rollbacks per Verification Window". Scale ranges from 0.0 to approximately 0.8, with tick marks at intervals of 0.2.
* **Y-axis:** "CDF" (Cumulative Distribution Function). Scale ranges from 0.0 to 1.0, with tick marks at intervals of 0.2.
* **Legend:** Located in the bottom-right of the chart. It identifies the different lines by color and corresponding window size:
* Blue: Window Size = 32
* Orange: Window Size = 64
* Green: Window Size = 128
* Red: Window Size = 256
### Detailed Analysis
* **Window Size = 32 (Blue):** The CDF starts at approximately 0.57 at 0 rollbacks, then increases rapidly between 0 and 0.4 rollbacks, reaching a CDF of approximately 0.95. It then gradually approaches 1.0.
* **Window Size = 64 (Orange):** The CDF starts at approximately 0.59 at 0 rollbacks, then increases rapidly between 0 and 0.4 rollbacks, reaching a CDF of approximately 0.9. It then gradually approaches 1.0.
* **Window Size = 128 (Green):** The CDF starts at approximately 0.58 at 0 rollbacks, then increases in steps between 0 and 0.6 rollbacks, reaching a CDF of approximately 0.98.
* **Window Size = 256 (Red):** The CDF starts at 0.0 at 0 rollbacks, then jumps to approximately 0.57, and then increases in steps between 0 and 0.6 rollbacks, reaching a CDF of approximately 0.95.
### Key Observations
* The CDF curves for smaller window sizes (32 and 64) increase more rapidly than those for larger window sizes (128 and 256).
* The CDF for window size 256 has a distinct step-like pattern, indicating discrete jumps in the cumulative distribution.
* All CDFs eventually approach 1.0, indicating that all rollbacks per verification window are accounted for in the cumulative distribution.
* The initial CDF value at 0 rollbacks is different for each window size, with window size 256 starting at 0.0.
### Interpretation
The plot illustrates the impact of window size on the distribution of rollbacks per verification window. Smaller window sizes (32 and 64) exhibit a more continuous increase in the CDF, suggesting a wider range of rollback values. Larger window sizes (128 and 256) show a more step-like CDF, indicating that rollbacks tend to occur in discrete increments. The initial jump in the CDF for window size 256 suggests that a significant portion of verification windows experience a certain number of rollbacks. The data suggests that the choice of window size can significantly affect the observed distribution of rollbacks, which could be important for optimizing system performance or resource allocation.