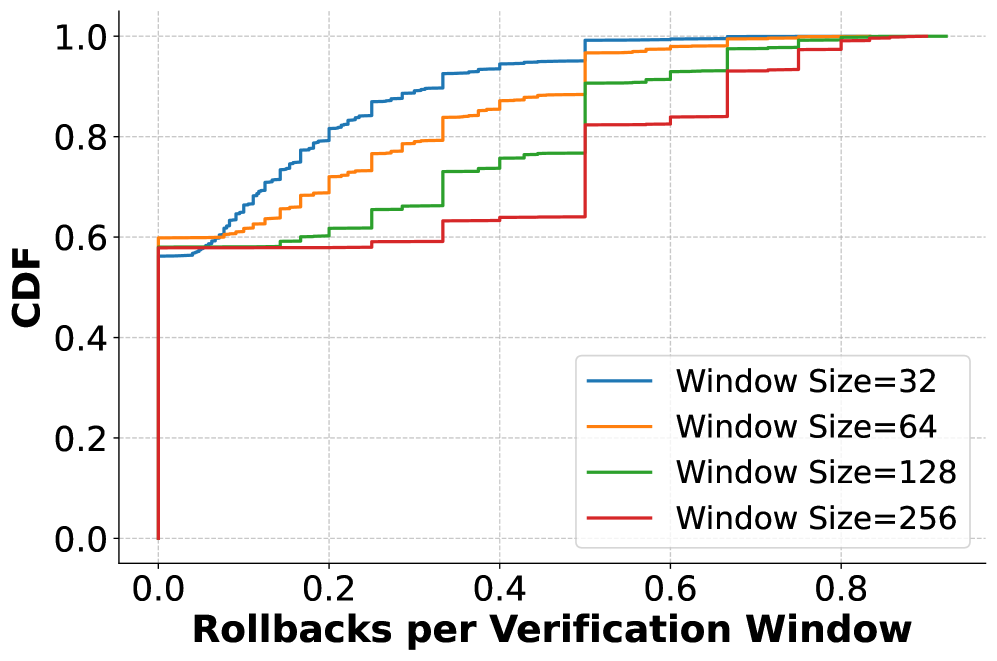
## Chart: Cumulative Distribution Function (CDF) of Rollbacks per Verification Window
### Overview
This image displays a Cumulative Distribution Function (CDF) plot illustrating the frequency of "Rollbacks per Verification Window" across four distinct configurations of "Window Size" (32, 64, 128, and 256). The chart demonstrates how increasing the verification window size correlates with a higher probability of experiencing rollbacks.
### Components/Axes
* **Y-Axis (Vertical):** Labeled "CDF" (Cumulative Distribution Function), representing the cumulative probability ranging from 0.0 to 1.0.
* **X-Axis (Horizontal):** Labeled "Rollbacks per Verification Window," representing the count of rollbacks observed within a specific window.
* **Data Series:** Four distinct lines representing different window sizes:
* **Window Size 32:** Represented by a specific color/style (e.g., blue).
* **Window Size 64:** Represented by a specific color/style (e.g., orange).
* **Window Size 128:** Represented by a specific color/style (e.g., green).
* **Window Size 256:** Represented by a specific color/style (e.g., red).
### Interpretation
The plot shows that as the "Window Size" increases, the CDF curves shift to the right, indicating that larger verification windows are associated with a higher number of rollbacks per window. The steepness of the curves indicates the distribution density; a steeper slope suggests a higher concentration of data points within that range of rollbacks.