## Chart: Cumulative Distribution Function of Rollbacks per Verification Window
### Overview
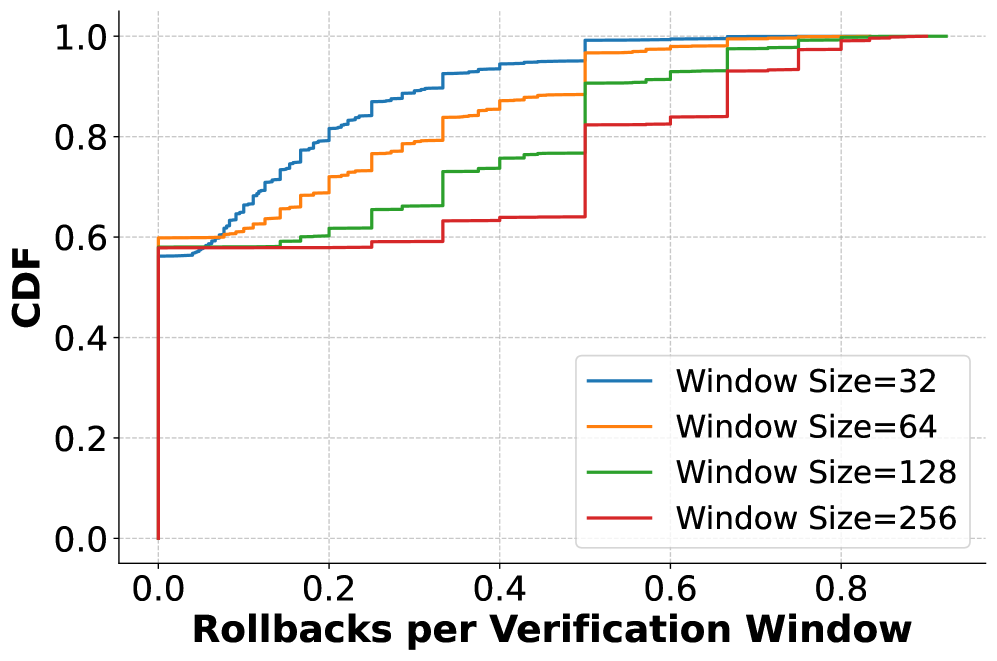
The image presents a cumulative distribution function (CDF) plot illustrating the relationship between the number of rollbacks per verification window and the CDF value. Four different window sizes (32, 64, 128, and 256) are compared. The plot shows how the probability of observing a certain number of rollbacks or fewer changes with different window sizes.
### Components/Axes
* **X-axis:** "Rollbacks per Verification Window" - Scale ranges from 0.0 to 0.9, with increments of 0.1.
* **Y-axis:** "CDF" - Scale ranges from 0.0 to 1.0, with increments of 0.2.
* **Legend:** Located in the top-right corner.
* Window Size=32 (Blue line)
* Window Size=64 (Orange line)
* Window Size=128 (Green line)
* Window Size=256 (Red line)
### Detailed Analysis
The chart displays four step-wise CDF curves, each representing a different window size.
* **Window Size=32 (Blue):** The CDF starts at approximately 0.52 at a rollback rate of 0.0. It steadily increases, reaching approximately 0.65 at a rollback rate of 0.2, 0.80 at 0.4, 0.90 at 0.6, 0.95 at 0.7, and approaching 1.0 at a rollback rate of 0.8.
* **Window Size=64 (Orange):** The CDF begins at approximately 0.55 at a rollback rate of 0.0. It rises to approximately 0.68 at 0.2, 0.82 at 0.4, 0.92 at 0.6, 0.96 at 0.7, and reaches approximately 1.0 at a rollback rate of 0.8.
* **Window Size=128 (Green):** The CDF starts at approximately 0.53 at a rollback rate of 0.0. It increases to approximately 0.66 at 0.2, 0.78 at 0.4, 0.88 at 0.6, 0.94 at 0.7, and reaches approximately 1.0 at a rollback rate of 0.8.
* **Window Size=256 (Red):** The CDF begins at approximately 0.54 at a rollback rate of 0.0. It rises to approximately 0.67 at 0.2, 0.80 at 0.4, 0.90 at 0.6, 0.95 at 0.7, and reaches approximately 1.0 at a rollback rate of 0.8.
All four lines start at similar CDF values around 0.5, but diverge as the rollback rate increases. The orange line (Window Size=64) generally exhibits the highest CDF values for any given rollback rate, indicating a higher probability of observing that rollback rate or lower. The green line (Window Size=128) generally exhibits the lowest CDF values.
### Key Observations
* Larger window sizes (64 and 256) tend to have higher CDF values at higher rollback rates, suggesting that they are less likely to experience high rollback rates compared to smaller window sizes (32 and 128).
* The CDF curves are step-wise, indicating that the data is likely discrete or grouped.
* The differences between the CDFs are most pronounced at rollback rates between 0.4 and 0.8.
### Interpretation
This chart demonstrates the impact of verification window size on the distribution of rollbacks. A larger window size appears to reduce the probability of experiencing a high number of rollbacks. This could be because a larger window allows for more thorough verification, reducing the likelihood of errors that lead to rollbacks. The step-wise nature of the CDF suggests that rollbacks occur in discrete amounts or are measured in discrete intervals. The chart suggests that choosing an appropriate window size is crucial for balancing verification thoroughness and rollback frequency. The data suggests that a window size of 64 provides the most robust performance in terms of minimizing rollbacks, while a window size of 128 appears to be the least effective. Further investigation would be needed to determine the optimal window size for a specific application, considering factors such as verification cost and the impact of rollbacks.