## Chart/Diagram Type: Integrated Information Theory (IIT) Diagrams and Data
### Overview
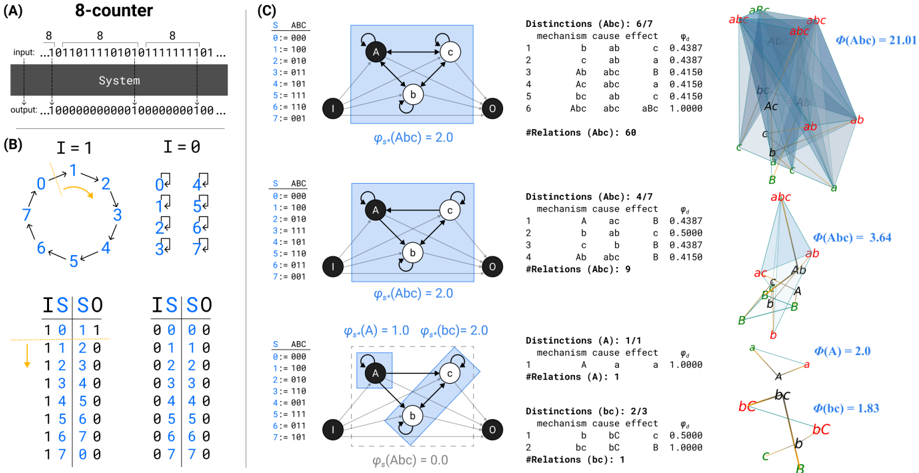
The image presents diagrams and data related to Integrated Information Theory (IIT), specifically illustrating the concept of distinctions, mechanisms, cause-effect structures, and integrated information (Φ) in a system. The image is divided into three sections: (A) an 8-counter system, (B) state transitions and input-output relationships, and (C) detailed IIT analysis of different mechanisms.
### Components/Axes
**Section A: 8-counter**
* **Title:** 8-counter
* **Elements:** A block representing a "System" with "input" and "output" arrows. The input is labeled as "...101101111010101111111101..." and the output is labeled as "...100000000000100000000100...".
* **Labels:** "input", "output", "System", "8" (appears three times above the input line).
**Section B: State Transitions**
* **Titles:** I = 1, I = 0
* **Diagrams:**
* **I = 1:** A circular diagram with states 0 through 7 arranged in a circle. An arrow indicates a clockwise transition.
* **I = 0:** Eight separate diagrams, each showing a single state (0-7) with a self-loop arrow.
* **Tables:** Two tables labeled "IS SO". The left table shows transitions for I=1, and the right table shows transitions for I=0.
**Section C: IIT Analysis**
* **Diagrams:** Three diagrams, each showing a network of nodes labeled A, b, c, I, and O. Arrows indicate causal relationships between the nodes. The nodes A, b, and c are highlighted in different ways in each diagram.
* **Tables:** Three tables, each associated with one of the diagrams. Each table shows "S" (state), "ABC" (binary representation of the state), "Distinctions (Mechanism)", "mechanism", "cause effect", and "Φd" (cause effect).
* **Values:** Φ(Abc) = 21.01, Φ(Abc) = 3.64, Φ(A) = 2.0, Φ(bc) = 1.83, φs.(Abc) = 2.0, φs.(A) = 1.0, φs.(bc) = 2.0, φs.(Abc) = 0.0
### Detailed Analysis
**Section A: 8-counter**
* The 8-counter system receives a binary input and produces a binary output. The specific sequences are provided.
**Section B: State Transitions**
* **I = 1:** The system cycles through states 0 to 7 in a clockwise manner.
* **I = 0:** The system remains in its current state.
* **Tables:**
* **I = 1:**
* IS: 1, 1, 2, 3, 4, 5, 6, 7
* SO: 1, 2, 3, 4, 5, 6, 7, 0
* **I = 0:**
* IS: 0, 1, 2, 3, 4, 5, 6, 7
* SO: 0, 1, 2, 3, 4, 5, 6, 7
**Section C: IIT Analysis**
**Top Diagram and Table:**
* **Diagram:** Nodes A, b, and c are highlighted with a light blue background.
* **Value:** φs.(Abc) = 2.0
* **Distinctions (Abc):** 6/7
* **#Relations (Abc):** 60
* **Table:**
* Mechanism: b, c, Ab, Ac, bc, Abc
* Cause effect: ab, ab, abc, abc, ab, abc
* Φd: 0.4387, 0.4387, 0.4150, 0.4150, 0.4150, 1.0000
* **Overall Integrated Information:** Φ(Abc) = 21.01
**Middle Diagram and Table:**
* **Diagram:** Nodes A, b, and c are highlighted with a light blue background.
* **Value:** φs.(Abc) = 2.0
* **Distinctions (Abc):** 4/7
* **#Relations (Abc):** 9
* **Table:**
* Mechanism: A, b, c, Ab
* Cause effect: ac, ab, b, abc
* Φd: 0.4387, 0.5000, 0.4387, 0.4150
* **Overall Integrated Information:** Φ(Abc) = 3.64
**Bottom Diagram and Tables:**
* **Diagram:** Node A is highlighted with a dashed light blue background, and nodes b and c are highlighted with a light blue background.
* **Values:** φs.(A) = 1.0, φs.(bc) = 2.0, φs.(Abc) = 0.0
* **Distinctions (A):** 1/1
* **#Relations (A):** 1
* **Table (A):**
* Mechanism: A
* Cause effect: a
* Φd: 1.0000
* **Overall Integrated Information:** Φ(A) = 2.0
* **Distinctions (bc):** 2/3
* **#Relations (bc):** 1
* **Table (bc):**
* Mechanism: b, bc
* Cause effect: bc, bc
* Φd: 0.5000, 1.0000
* **Overall Integrated Information:** Φ(bc) = 1.83
### Key Observations
* The 8-counter system demonstrates a simple state transition mechanism.
* The IIT analysis explores how different mechanisms (A, b, c, Abc) contribute to the overall integrated information (Φ).
* The values of Φ vary significantly depending on the mechanism and its distinctions.
* The diagrams visually represent the causal relationships between the nodes in the system.
### Interpretation
The image illustrates the core concepts of Integrated Information Theory (IIT). Section A provides a basic system (8-counter) for analysis. Section B shows how the system transitions between states based on the input. Section C delves into the IIT analysis, demonstrating how different mechanisms within the system contribute to the overall integrated information (Φ). The distinctions and relations are quantified, and the cause-effect structures are visualized. The varying Φ values suggest that different mechanisms have different levels of integration and causal power within the system. The diagrams in Section C highlight the importance of considering the relationships between different parts of the system to understand its overall integrated information. The differences in Φ values between the top, middle, and bottom diagrams indicate how the choice of mechanism affects the overall integrated information.