## Diagram: 8-Counter System with State Transitions and Network Analysis
### Overview
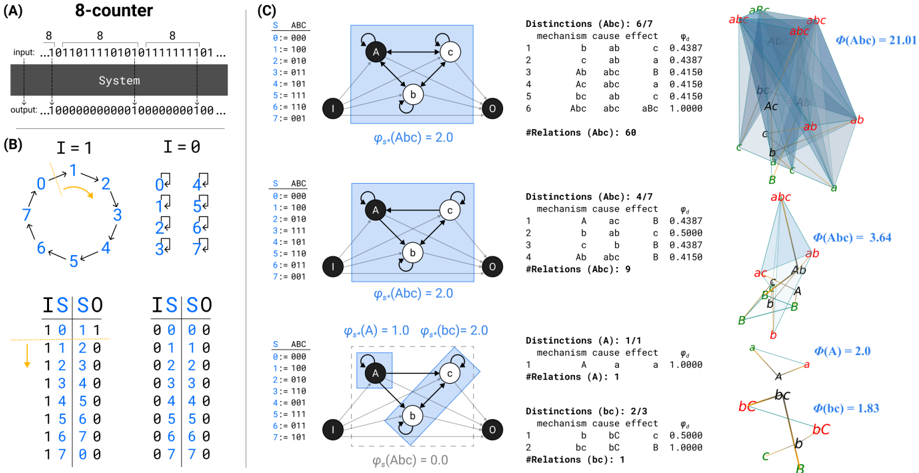
The image presents a technical system diagram divided into three sections (A, B, C). Section A describes an 8-bit counter system with input/output sequences and state transitions. Section B details state transition logic with binary tables and a circular flow diagram. Section C contains network graphs, statistical distinctions, and a 3D plot of Φ values.
### Components/Axes
**Section A (8-Counter System):**
- **Input/Output:** 8-bit input sequence (e.g., `10101110`) and 16-bit output sequence (e.g., `0000000000000000`).
- **System Block:** Central processing unit labeled "System."
- **State Diagram:** Circular flow connecting states 0→1→2→3→4→5→6→7→0 with transitions labeled by input (I=1 or I=0).
- **Transition Tables:**
- **IS (Current State):** 0-7
- **SO (Next State):** 0-7
- **Input:** 0 or 1
- Example: When I=1, state 0 transitions to 1; when I=0, state 0 transitions to 4.
**Section B (State Transition Logic):**
- **Circular Flow Diagram:** States 0-7 arranged in a circle with directional arrows.
- **Binary Tables:**
- **IS (Current State):** 0-7
- **SO (Next State):** 0-7
- **Input:** 0 or 1
- Example: State 0 transitions to 1 (I=1) or 4 (I=0).
**Section C (Network Analysis):**
- **Graphs (A, B, C):**
- **Nodes:** Labeled A, B, C.
- **Edges:** Weighted connections (e.g., `φ(A,B)=2.0`).
- **Distinctions:** Numerical values (e.g., "Distinctions (A:B,C): 6/7").
- **Relations:** Numerical values (e.g., "#Relations (A:B,C): 60").
- **3D Plot:**
- **Axes:** Φ(A), Φ(B), Φ(C) with values (e.g., Φ(A)=2.01, Φ(B)=3.64, Φ(C)=2.0).
- **Color Coding:** Nodes/edges differentiated by color (e.g., blue, green, red).
### Detailed Analysis
**Section A:**
- **Input/Output:** Input sequences are 8-bit binary strings; outputs are 16-bit binary strings. Example: Input `10101110` maps to output `0000000000000000`.
- **State Transitions:**
- **I=1:** States increment by 1 (e.g., 0→1, 1→2).
- **I=0:** States jump to specific values (e.g., 0→4, 1→5).
- Tables confirm transitions (e.g., IS=0, I=0 → SO=4).
**Section B:**
- **Transition Logic:**
- **I=1:** Linear progression (0→1→2→3→4→5→6→7→0).
- **I=0:** Non-linear jumps (e.g., 0→4, 1→5, 2→6, 3→7, 4→0, 5→1, 6→2, 7→3).
- Tables validate transitions (e.g., IS=3, I=0 → SO=7).
**Section C:**
- **Graph Configurations:**
- **ABC:** Fully connected nodes with weights (e.g., `φ(A,B)=2.0`).
- **A:** Single node with self-loop (φ(A,A)=1.0).
- **B/C:** Partial connections (e.g., `φ(B,C)=0.5`).
- **Distinctions/Relations:**
- **Distinctions:** Ratio of unique node pairs (e.g., 6/7 for ABC).
- **Relations:** Total connections (e.g., 60 for ABC).
- **3D Plot:**
- **Φ Values:**
- Φ(A)=2.01, Φ(B)=3.64, Φ(C)=2.0.
- **Interpretation:** Φ likely represents a metric (e.g., system complexity, stability) derived from distinctions/relations.
### Key Observations
1. **State Transitions:**
- I=1 enables linear progression; I=0 introduces non-linear jumps.
- Example: State 0 transitions to 4 (I=0) but loops back to 0 (I=1 after 7→0).
2. **Network Graphs:**
- ABC graph has the highest distinctions (6/7) and relations (60), suggesting dense connectivity.
- A graph (single node) has minimal distinctions (1/1) and relations (1).
3. **3D Plot:**
- Φ(B) is the highest (3.64), indicating B may be a critical node or parameter.
- Φ(A) and Φ(C) are similar (2.01 vs. 2.0), suggesting symmetry in A and C.
### Interpretation
- **System Behavior:** The 8-counter system processes inputs to generate outputs, with state transitions governed by binary logic. The circular flow ensures cyclical operation, while I=0 introduces conditional jumps.
- **Network Analysis:** Section C’s graphs and 3D plot likely model interactions between components (A, B, C). High distinctions/relations in ABC suggest robust connectivity, while isolated nodes (A) have minimal interactions.
- **Φ Metric:** The 3D plot’s Φ values may quantify system properties (e.g., stability, efficiency). Φ(B)’s higher value could indicate B’s central role in the network.
- **Anomalies:** The 3D plot’s Φ(B)=3.64 is significantly higher than Φ(A) and Φ(C), suggesting B is a focal point. This aligns with the ABC graph’s dense connections.
### Conclusion
The diagram illustrates a hybrid system combining state-based logic (A/B) and network analysis (C). The 8-counter’s transitions and the network’s Φ values highlight how input/output and connectivity influence system behavior. The 3D plot’s Φ metric provides a quantitative measure of these dynamics, emphasizing the importance of node B in the network.