## Line Chart: Parallel vs. Sequential Scaling: MATH-500
### Overview
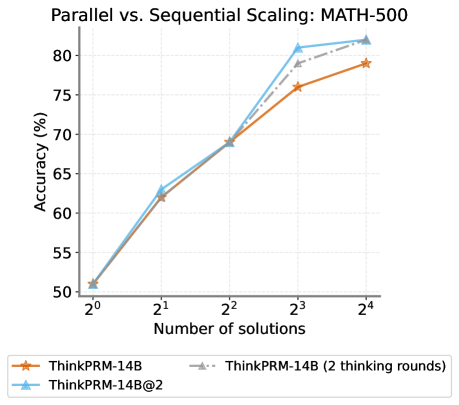
The image is a line chart comparing the accuracy (%) of different models (ThinkPRM-14B, ThinkPRM-14B@2, and ThinkPRM-14B (2 thinking rounds)) as the number of solutions increases, specifically in the context of MATH-500. The x-axis represents the number of solutions (ranging from 2^0 to 2^4), and the y-axis represents the accuracy in percentage (ranging from 50% to 80%).
### Components/Axes
* **Title:** Parallel vs. Sequential Scaling: MATH-500
* **X-axis Title:** Number of solutions
* **X-axis Scale:** 2^0, 2^1, 2^2, 2^3, 2^4
* **Y-axis Title:** Accuracy (%)
* **Y-axis Scale:** 50, 55, 60, 65, 70, 75, 80
* **Legend:** Located at the bottom of the chart.
* ThinkPRM-14B (Orange line with star markers)
* ThinkPRM-14B@2 (Blue line with triangle markers)
* ThinkPRM-14B (2 thinking rounds) (Gray dashed line with triangle markers)
### Detailed Analysis
* **ThinkPRM-14B (Orange line with star markers):**
* Trend: The accuracy increases as the number of solutions increases.
* Data Points:
* 2^0 solutions: Accuracy ~51%
* 2^1 solutions: Accuracy ~62%
* 2^2 solutions: Accuracy ~69%
* 2^3 solutions: Accuracy ~76%
* 2^4 solutions: Accuracy ~79%
* **ThinkPRM-14B@2 (Blue line with triangle markers):**
* Trend: The accuracy increases as the number of solutions increases.
* Data Points:
* 2^0 solutions: Accuracy ~51%
* 2^1 solutions: Accuracy ~63%
* 2^2 solutions: Accuracy ~69%
* 2^3 solutions: Accuracy ~81%
* 2^4 solutions: Accuracy ~82%
* **ThinkPRM-14B (2 thinking rounds) (Gray dashed line with triangle markers):**
* Trend: The accuracy increases as the number of solutions increases.
* Data Points:
* 2^0 solutions: Accuracy ~51%
* 2^1 solutions: Accuracy ~62%
* 2^2 solutions: Accuracy ~69%
* 2^3 solutions: Accuracy ~79%
* 2^4 solutions: Accuracy ~81%
### Key Observations
* All three models show an increase in accuracy as the number of solutions increases.
* ThinkPRM-14B@2 generally performs better than the other two models, especially at higher numbers of solutions.
* ThinkPRM-14B (2 thinking rounds) performs slightly better than ThinkPRM-14B, but not as well as ThinkPRM-14B@2.
* The performance of all three models converges at a low number of solutions (2^0 and 2^1).
### Interpretation
The chart demonstrates the scaling performance of different models in solving MATH-500 problems. The x-axis represents the number of solutions considered, and the y-axis represents the accuracy achieved. The results suggest that increasing the number of solutions generally improves accuracy for all models. ThinkPRM-14B@2 appears to be the most effective model, achieving the highest accuracy at higher numbers of solutions. The "2 thinking rounds" modification to ThinkPRM-14B provides a modest improvement, but not as significant as the architectural changes in ThinkPRM-14B@2. The convergence of performance at lower solution counts suggests that the models are similarly constrained when limited to a small search space.