## Line Chart: Parallel vs. Sequential Scaling: MATH-300
### Overview
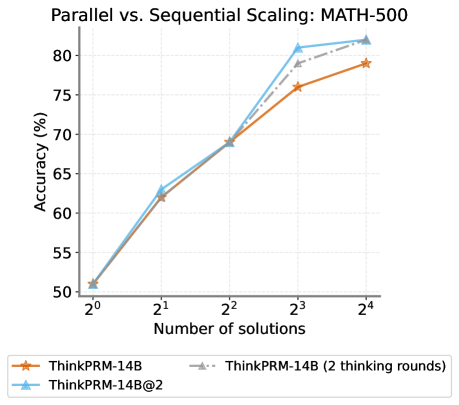
This line chart compares the accuracy of three different models (ThinkPRM-14B, ThinkPRM-14B with 2 thinking rounds, and ThinkPRM-14B@2) on the MATH-300 dataset as the number of solutions increases. The x-axis represents the number of solutions (on a logarithmic scale), and the y-axis represents the accuracy in percentage.
### Components/Axes
* **Title:** Parallel vs. Sequential Scaling: MATH-300 (top-center)
* **X-axis Label:** Number of solutions (bottom-center)
* **X-axis Markers:** 2⁰, 2¹, 2², 2³, 2⁴
* **Y-axis Label:** Accuracy (%) (left-center)
* **Y-axis Scale:** 50%, 55%, 60%, 65%, 70%, 75%, 80%
* **Legend:** Located at the bottom-center of the chart.
* **ThinkPRM-14B:** Orange solid line with star marker.
* **ThinkPRM-14B (2 thinking rounds):** Gray dashed line with triangle marker.
* **ThinkPRM-14B@2:** Blue solid line with circle marker.
### Detailed Analysis
* **ThinkPRM-14B (Orange):** The line slopes upward consistently.
* At 2⁰ (1 solution): Approximately 51% accuracy.
* At 2¹ (2 solutions): Approximately 62% accuracy.
* At 2² (4 solutions): Approximately 69% accuracy.
* At 2³ (8 solutions): Approximately 77% accuracy.
* At 2⁴ (16 solutions): Approximately 79% accuracy.
* **ThinkPRM-14B (2 thinking rounds) (Gray):** The line also slopes upward, but is generally above the orange line.
* At 2⁰ (1 solution): Approximately 54% accuracy.
* At 2¹ (2 solutions): Approximately 64% accuracy.
* At 2² (4 solutions): Approximately 70% accuracy.
* At 2³ (8 solutions): Approximately 81% accuracy.
* At 2⁴ (16 solutions): Approximately 81% accuracy.
* **ThinkPRM-14B@2 (Blue):** The line slopes upward and is generally above the gray line.
* At 2⁰ (1 solution): Approximately 52% accuracy.
* At 2¹ (2 solutions): Approximately 63% accuracy.
* At 2² (4 solutions): Approximately 71% accuracy.
* At 2³ (8 solutions): Approximately 81% accuracy.
* At 2⁴ (16 solutions): Approximately 81% accuracy.
### Key Observations
* All three models show increasing accuracy as the number of solutions increases.
* ThinkPRM-14B@2 and ThinkPRM-14B (2 thinking rounds) achieve the highest accuracy, reaching approximately 81% at 2³ and 2⁴ solutions.
* ThinkPRM-14B has the lowest accuracy across all solution numbers.
* The performance gap between the models appears to narrow at higher numbers of solutions (2³ and 2⁴).
### Interpretation
The data suggests that increasing the number of solutions improves the accuracy of all three models on the MATH-300 dataset. The models that utilize multiple thinking rounds (ThinkPRM-14B (2 thinking rounds) and ThinkPRM-14B@2) demonstrate superior performance compared to the base model (ThinkPRM-14B). This indicates that iterative reasoning or parallel processing of solutions is beneficial for solving mathematical problems. The plateauing of accuracy at higher solution numbers (2³ and 2⁴) might suggest a diminishing return on investment in further increasing the number of solutions, or that the models are approaching their maximum achievable accuracy on this dataset. The difference between ThinkPRM-14B@2 and ThinkPRM-14B (2 thinking rounds) is minimal, suggesting that the benefit of the "@2" configuration is not substantial.