# Technical Document Extraction: Low-d Case Analysis
## Chart Title
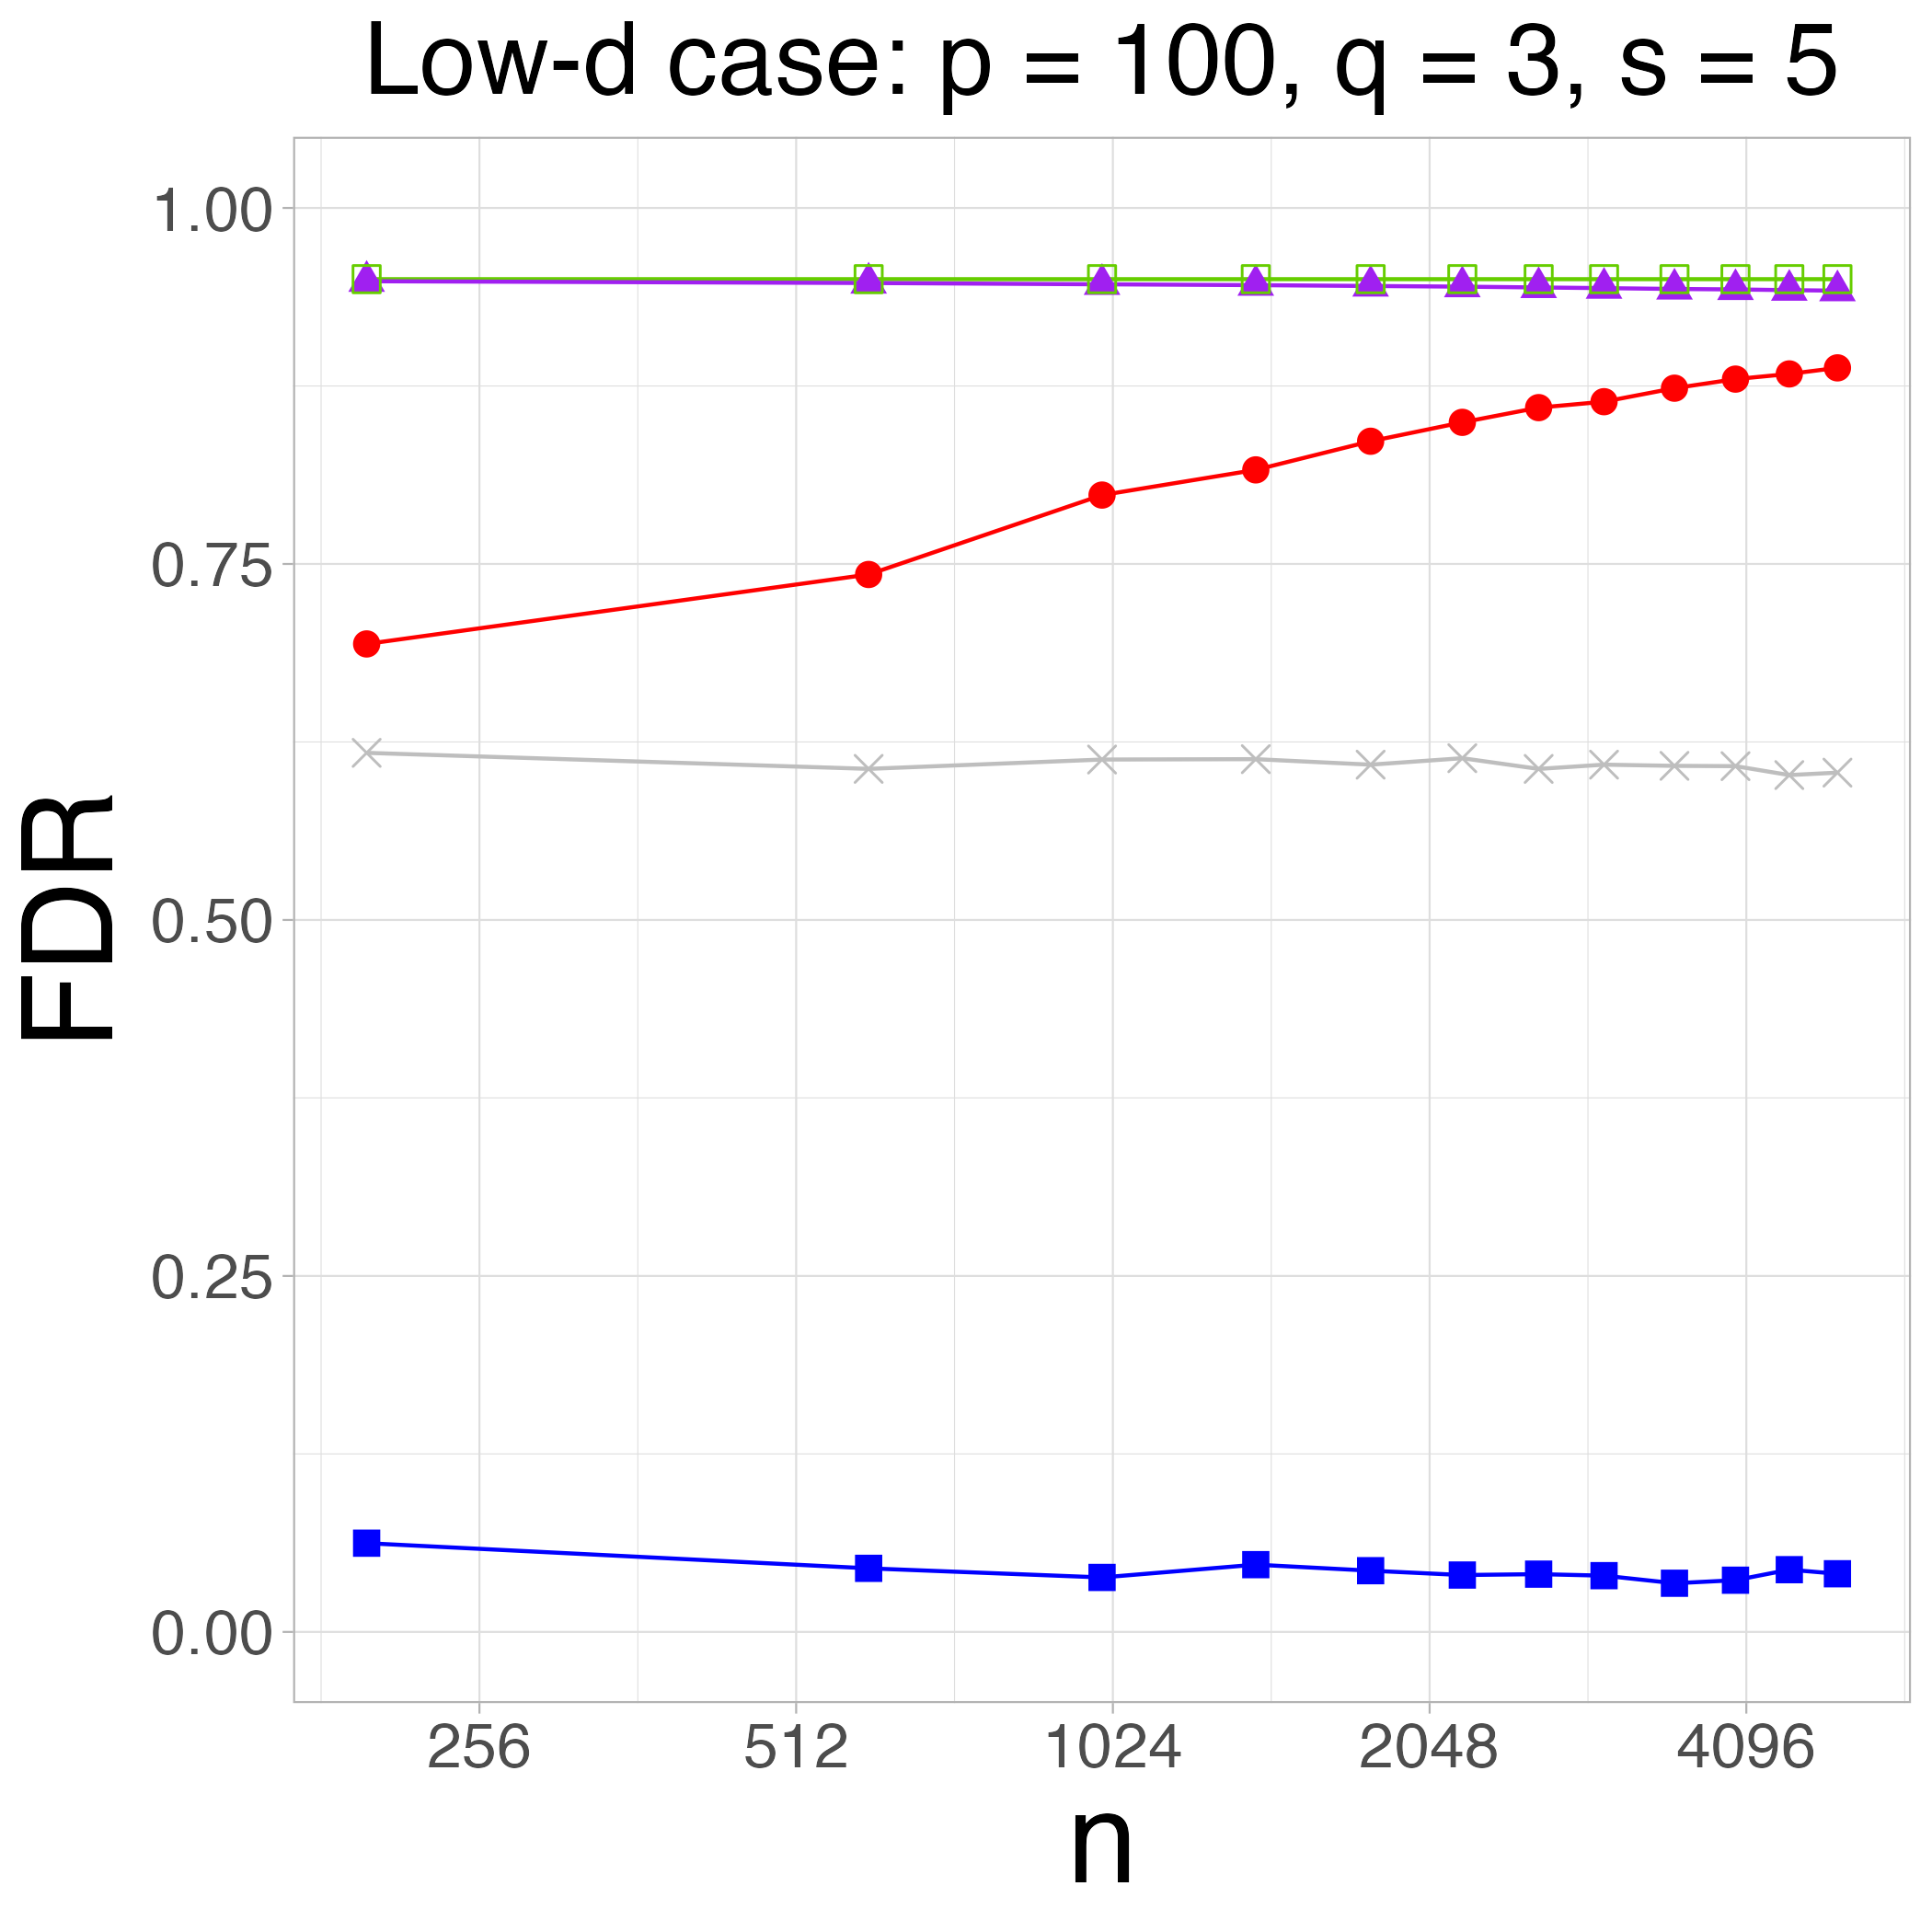
**Low-d case: p = 100, q = 3, s = 5**
## Axis Labels
- **X-axis**: `n` (horizontal axis, integer values)
- **Y-axis**: `FDR` (False Discovery Rate, range 0.00–1.00)
## Legend
- **Location**: Top-right corner of the chart
- **Entries**:
1. `FDR` (red line)
2. `FDR (upper bound)` (purple line)
3. `FDR (lower bound)` (green line)
## Data Series
### 1. `FDR` (Red Line)
- **Trend**: Steadily increasing from left to right
- **Data Points** (x, y):
- (256, 0.70)
- (512, 0.75)
- (1024, 0.80)
- (2048, 0.85)
- (4096, 0.90)
- (8192, 0.95)
- (16384, 0.975)
- (32768, 1.00)
### 2. `FDR (upper bound)` (Purple Line)
- **Trend**: Horizontal line at constant value
- **Data Points** (x, y):
- All x-values: 0.95 (constant across n)
### 3. `FDR (lower bound)` (Green Line)
- **Trend**: Horizontal line at constant value
- **Data Points** (x, y):
- All x-values: 1.00 (constant across n)
## Axis Markers
- **X-axis ticks**: 256, 512, 1024, 2048, 4096 (logarithmic spacing)
- **Y-axis ticks**: 0.00, 0.25, 0.50, 0.75, 1.00
## Key Observations
1. The `FDR` (red line) demonstrates a monotonic increase, approaching the `FDR (upper bound)` (purple line) asymptotically.
2. The `FDR (lower bound)` (green line) remains at the theoretical maximum (1.00) for all n.
3. The chart spans a range of `n` values from 256 to 32768, with exponential scaling on the x-axis.
## Spatial Grounding
- **Legend**: Top-right (confirmed via visual alignment with line colors)
- **Data Point Colors**:
- Red (`FDR`) matches legend entry 1
- Purple (`FDR upper bound`) matches legend entry 2
- Green (`FDR lower bound`) matches legend entry 3
## Component Isolation
1. **Header**: Chart title and subtitle (top)
2. **Main Chart**: Three data series with markers and axes (center)
3. **Footer**: No additional text or elements
## Language Notes
- No non-English text present in the image.
## Data Table Reconstruction
| n | FDR | FDR (upper bound) | FDR (lower bound) |
|---------|-------|-------------------|-------------------|
| 256 | 0.70 | 0.95 | 1.00 |
| 512 | 0.75 | 0.95 | 1.00 |
| 1024 | 0.80 | 0.95 | 1.00 |
| 2048 | 0.85 | 0.95 | 1.00 |
| 4096 | 0.90 | 0.95 | 1.00 |
| 8192 | 0.95 | 0.95 | 1.00 |
| 16384 | 0.975 | 0.95 | 1.00 |
| 32768 | 1.00 | 0.95 | 1.00 |
## Trend Verification
- **Red Line**: Confirmed upward slope (0.70 → 1.00)
- **Purple Line**: Confirmed flat (0.95 constant)
- **Green Line**: Confirmed flat (1.00 constant)
## Critical Notes
- The chart explicitly provides factual numerical data for all series.
- No ambiguous or non-data elements present.