## Heatmap: Baseline - Core Generalization - Qwen-2.5 1.5B
### Overview
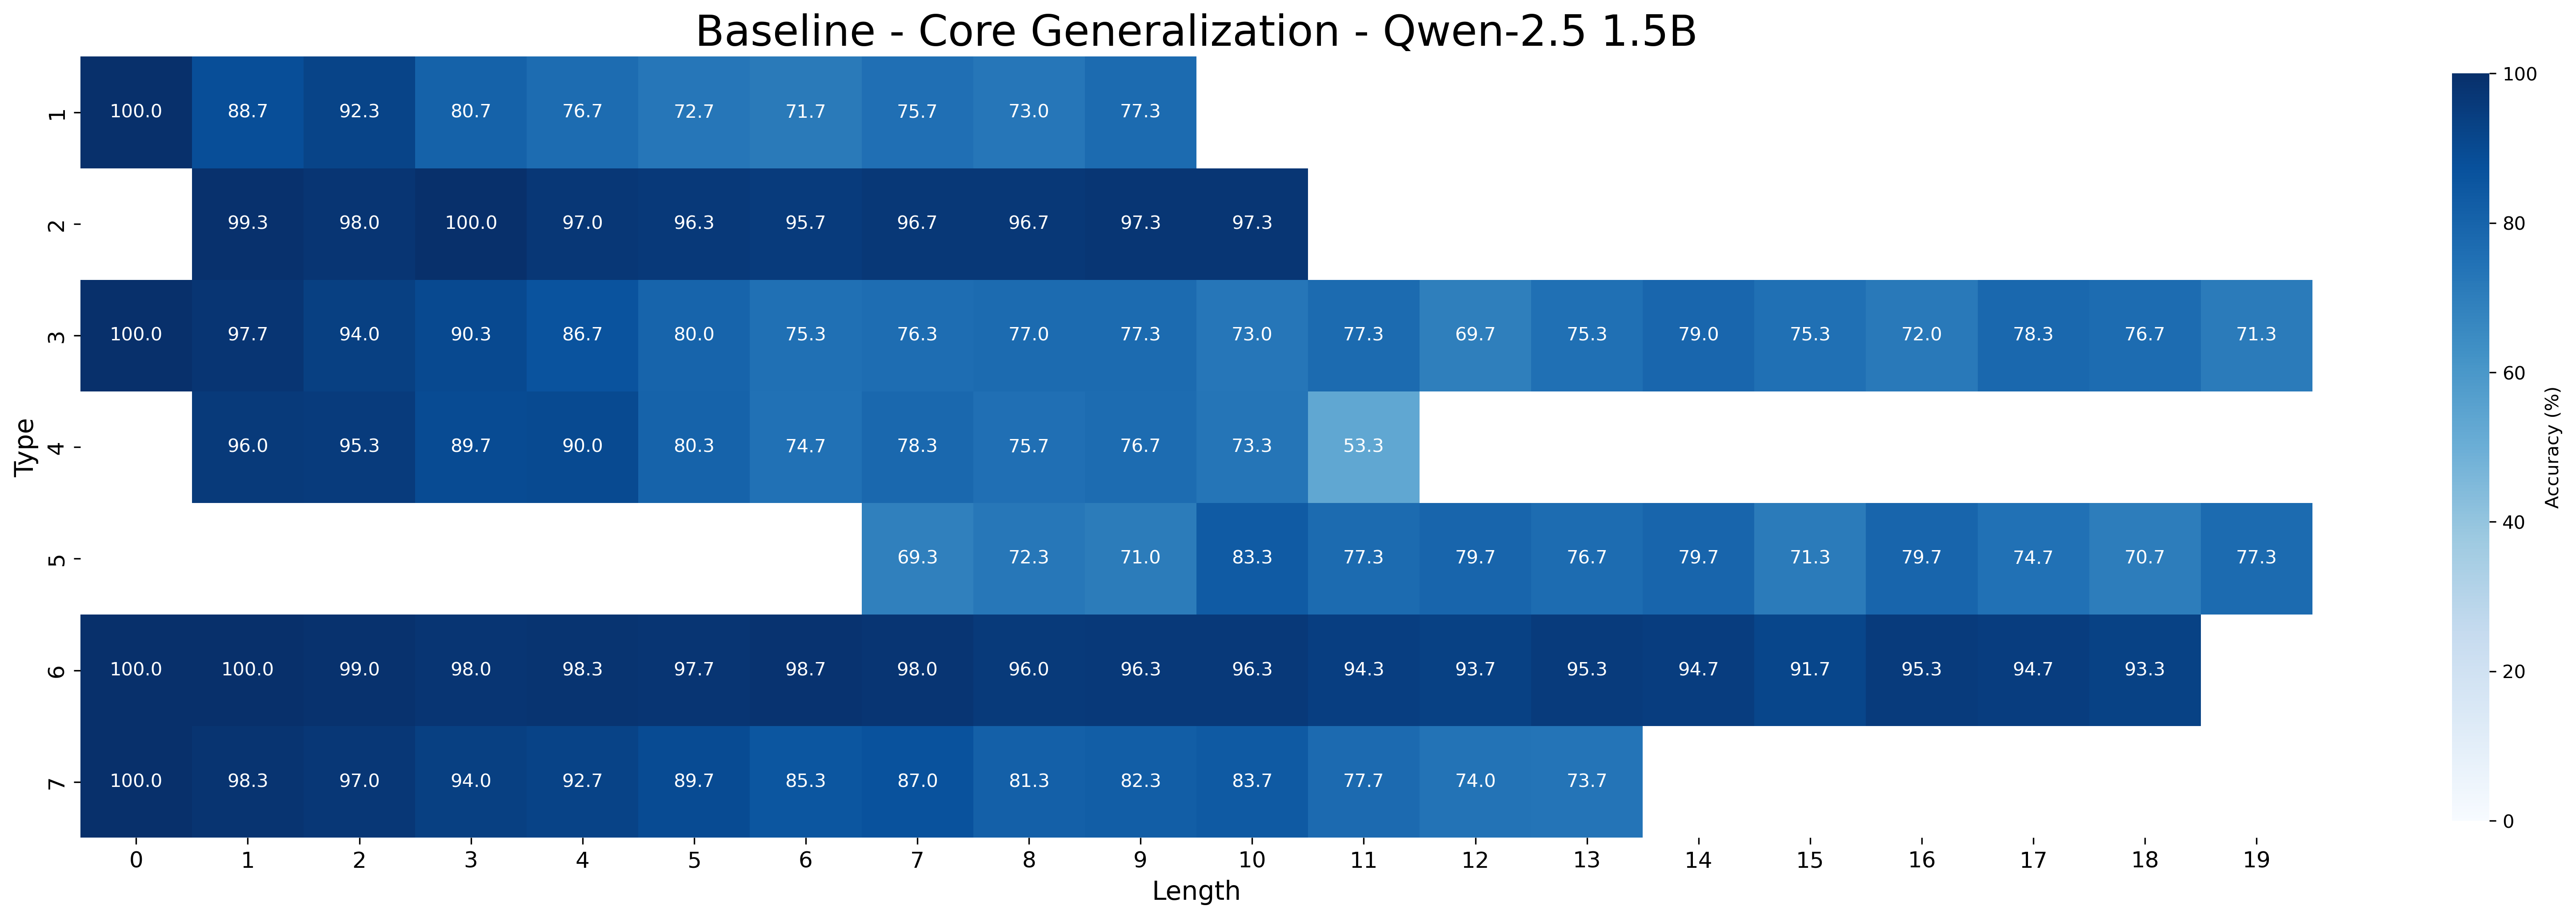
The image is a heatmap visualizing the accuracy of a baseline model (Qwen-2.5 1.5B) on a core generalization task. The heatmap displays accuracy percentages for different "Types" (1 to 7) across varying sequence "Lengths" (0 to 19). The color intensity corresponds to the accuracy, with darker blue indicating higher accuracy and lighter blue indicating lower accuracy.
### Components/Axes
* **Title:** Baseline - Core Generalization - Qwen-2.5 1.5B
* **Y-axis:** "Type" labeled 1 to 7.
* **X-axis:** "Length" labeled 0 to 19.
* **Colorbar (Right):** "Accuracy (%)" ranging from 0 to 100, with a gradient from light blue (0%) to dark blue (100%).
### Detailed Analysis
The heatmap presents accuracy values for each combination of "Type" and "Length." Here's a breakdown of the data:
* **Type 1:** Accuracy starts at 100% for length 0, then decreases to 88.7% (length 1), 92.3% (length 2), 80.7% (length 3), 76.7% (length 4), 72.7% (length 5), 71.7% (length 6), 75.7% (length 7), 73.0% (length 8), and 77.3% (length 9).
* **Type 2:** Accuracy is high across all lengths, starting at 99.3% (length 0), 98.0% (length 1), 100.0% (length 2), 97.0% (length 3), 96.3% (length 4), 95.7% (length 5), 96.7% (length 6), 96.7% (length 7), 97.3% (length 8), and 97.3% (length 9).
* **Type 3:** Accuracy starts at 100% (length 0), then decreases to 97.7% (length 1), 94.0% (length 2), 90.3% (length 3), 86.7% (length 4), 80.0% (length 5), 75.3% (length 6), 76.3% (length 7), 77.0% (length 8), 77.3% (length 9), 73.0% (length 10), 77.3% (length 11), 69.7% (length 12), 75.3% (length 13), 79.0% (length 14), 75.3% (length 15), 72.0% (length 16), 78.3% (length 17), 76.7% (length 18), and 71.3% (length 19).
* **Type 4:** Accuracy starts at 96.0% (length 0), then decreases to 95.3% (length 1), 89.7% (length 2), 90.0% (length 3), 80.3% (length 4), 74.7% (length 5), 78.3% (length 6), 75.7% (length 7), 76.7% (length 8), 73.3% (length 9), and 53.3% (length 10).
* **Type 5:** Accuracy values are only available for lengths 7 to 19, starting at 69.3% (length 7), 72.3% (length 8), 71.0% (length 9), 83.3% (length 10), 77.3% (length 11), 79.7% (length 12), 76.7% (length 13), 79.7% (length 14), 71.3% (length 15), 79.7% (length 16), 74.7% (length 17), 70.7% (length 18), and 77.3% (length 19).
* **Type 6:** Accuracy is consistently high across all lengths, starting at 100.0% (length 0), 100.0% (length 1), 99.0% (length 2), 98.0% (length 3), 98.3% (length 4), 97.7% (length 5), 98.7% (length 6), 98.0% (length 7), 96.0% (length 8), 96.3% (length 9), 96.3% (length 10), 94.3% (length 11), 93.7% (length 12), 95.3% (length 13), 94.7% (length 14), 91.7% (length 15), 95.3% (length 16), 94.7% (length 17), and 93.3% (length 18).
* **Type 7:** Accuracy starts at 100.0% (length 0), then decreases to 98.3% (length 1), 97.0% (length 2), 94.0% (length 3), 92.7% (length 4), 89.7% (length 5), 85.3% (length 6), 87.0% (length 7), 81.3% (length 8), 82.3% (length 9), 83.7% (length 10), 77.7% (length 11), 74.0% (length 12), and 73.7% (length 13).
### Key Observations
* Types 2 and 6 consistently show high accuracy across all lengths.
* Types 1, 3, 4, and 7 show a general decreasing trend in accuracy as the length increases.
* Type 5 has missing data for shorter lengths (0-6).
* Type 4 shows a significant drop in accuracy at length 10 (53.3%).
### Interpretation
The heatmap illustrates the performance of the Qwen-2.5 1.5B model on different types of tasks or data categories ("Types") as the sequence length increases. The high accuracy for Types 2 and 6 suggests that the model generalizes well for these specific tasks, regardless of the input length. The decreasing accuracy for Types 1, 3, 4, and 7 indicates that the model's performance degrades as the sequence length increases, possibly due to the model's difficulty in handling longer dependencies or increased complexity. The missing data for Type 5 at shorter lengths could indicate that this type of task is only relevant or defined for longer sequences. The significant drop in accuracy for Type 4 at length 10 could be due to a specific characteristic of the data or task at that length, which the model struggles to handle. Overall, the heatmap provides insights into the model's strengths and weaknesses in generalizing across different tasks and sequence lengths.