## Heatmap: Baseline - Core Generalization - Qwen-2.5 1.5B
### Overview
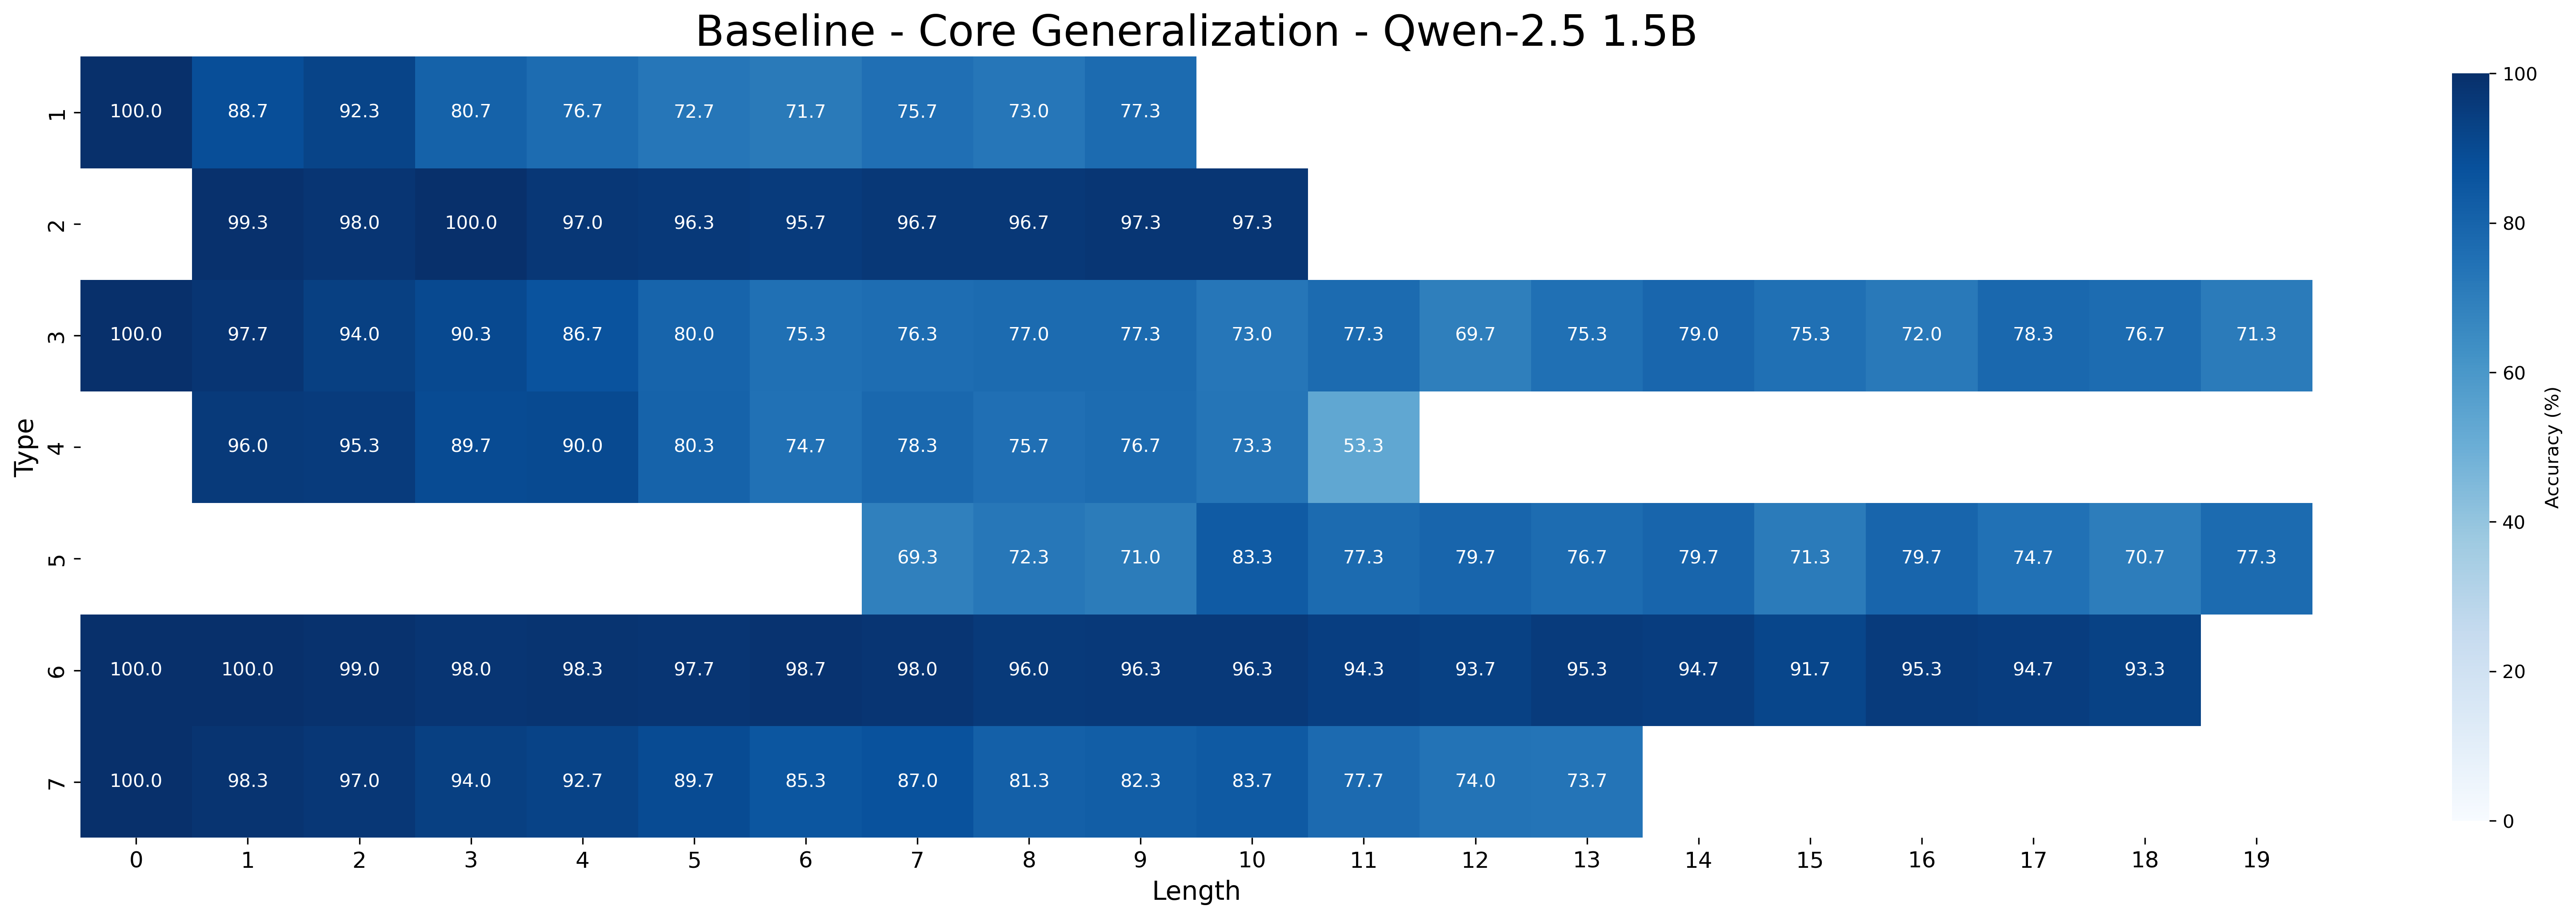
This image presents a heatmap visualizing the accuracy of a model (Qwen-2.5 1.5B) across different sequence lengths and input types. The heatmap displays accuracy as a percentage, with color intensity representing the accuracy level.
### Components/Axes
* **Title:** Baseline - Core Generalization - Qwen-2.5 1.5B (Top-center)
* **X-axis:** Length (ranging from 0 to 19, in increments of 1). (Bottom-center)
* **Y-axis:** Type (with categories: 'H', '2', 'M', '4', 'U', '7'). (Left-center)
* **Color Scale:** Accuracy (%) ranging from 0 to 100. (Right-center) The color gradient transitions from light blue (low accuracy) to dark teal/green (high accuracy).
### Detailed Analysis
The heatmap is a 6x20 grid, with each cell representing the accuracy for a specific combination of 'Type' and 'Length'. I will analyze each row (Type) and describe the trend, then list the approximate values.
* **Type 'H'**: Accuracy is consistently high, starting at approximately 100% for Length 0 and decreasing slightly to around 73.3% for Length 19. The trend is a gentle downward slope.
* Length 0: 100.0%
* Length 1: 88.7%
* Length 2: 92.3%
* Length 3: 80.7%
* Length 4: 72.7%
* Length 5: 71.7%
* Length 6: 73.0%
* Length 7: 73.3%
* **Type '2'**: Accuracy starts very high at approximately 99.3% for Length 0, and decreases to around 91.3% for Length 19. The trend is a gentle downward slope.
* Length 0: 99.3%
* Length 1: 98.0%
* Length 2: 100.0%
* Length 3: 96.3%
* Length 4: 95.7%
* Length 5: 96.7%
* Length 6: 97.3%
* Length 7: 91.3%
* **Type 'M'**: Accuracy begins at approximately 97.7% for Length 0, and decreases to around 71.3% for Length 19. The trend is a downward slope, slightly steeper than 'H' and '2'.
* Length 0: 97.7%
* Length 1: 94.0%
* Length 2: 86.7%
* Length 3: 80.0%
* Length 4: 75.3%
* Length 5: 77.0%
* Length 6: 71.0%
* Length 7: 73.3%
* **Type '4'**: Accuracy starts at approximately 96.0% for Length 0, and decreases to around 53.3% for Length 19. The trend is a more pronounced downward slope.
* Length 0: 96.0%
* Length 1: 95.3%
* Length 2: 89.0%
* Length 3: 80.3%
* Length 4: 74.8%
* Length 5: 75.7%
* Length 6: 73.3%
* Length 7: 53.3%
* **Type 'U'**: Accuracy starts at approximately 69.3% for Length 0, and increases to around 79.7% for Length 7, then decreases to around 70.7% for Length 19. The trend is a slight increase followed by a decrease.
* Length 0: 69.3%
* Length 1: 72.3%
* Length 2: 80.3%
* Length 3: 77.3%
* Length 4: 79.7%
* Length 5: 79.9%
* Length 6: 71.3%
* Length 7: 74.7%
* **Type '7'**: Accuracy starts at approximately 100.0% for Length 0, and decreases to around 73.7% for Length 19. The trend is a gentle downward slope.
* Length 0: 100.0%
* Length 1: 98.3%
* Length 2: 97.0%
* Length 3: 94.7%
* Length 4: 89.7%
* Length 5: 85.3%
* Length 6: 81.3%
* Length 7: 77.7%
### Key Observations
* The highest accuracies are generally observed for shorter lengths (0-5) across most types.
* Type 'H' and '7' consistently exhibit the highest accuracy across all lengths.
* Type '4' shows the most significant decrease in accuracy as length increases.
* Type 'U' has a unique pattern of initially increasing accuracy before decreasing.
* Accuracy generally decreases as the sequence length increases for most types.
### Interpretation
The heatmap demonstrates the model's performance on different input types and sequence lengths. The consistent high accuracy for types 'H' and '7' suggests the model is well-suited for those specific input characteristics. The decreasing accuracy with increasing length indicates a potential limitation in the model's ability to handle longer sequences effectively. The unique behavior of type 'U' might suggest a specific pattern or characteristic within that input type that initially benefits from increased length but then becomes detrimental. This data is valuable for understanding the model's strengths and weaknesses and for guiding further development or fine-tuning efforts. The "Baseline" in the title suggests this is a starting point for comparison with other models or configurations. The "Core Generalization" indicates the test focuses on fundamental capabilities rather than specialized tasks.