## Heatmap: Baseline - Core Generalization - Qwen-2.5 1.5B
### Overview
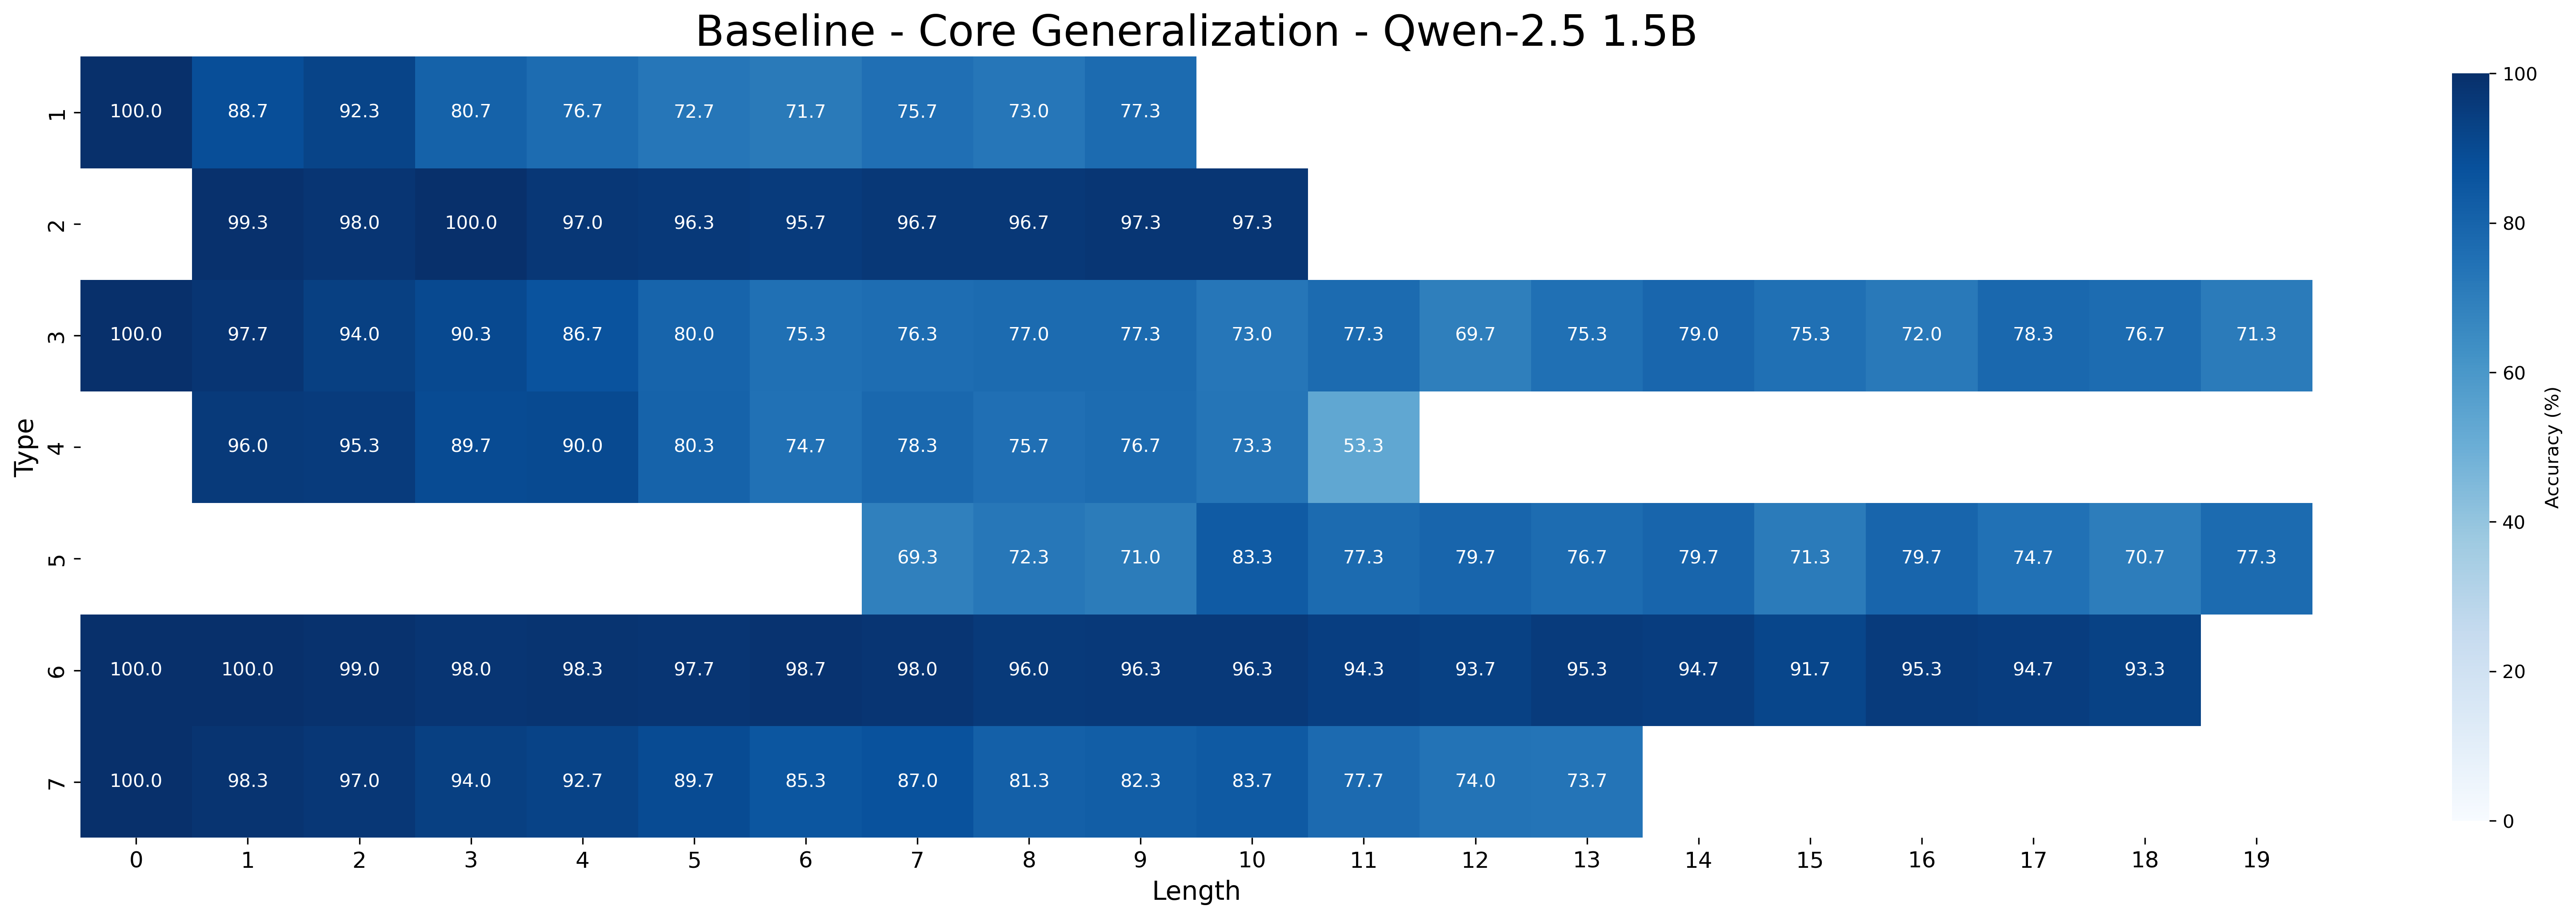
This image is a heatmap visualizing the performance accuracy (in percentage) of a model named "Qwen-2.5 1.5B" on a "Core Generalization" task. The chart plots performance across two dimensions: "Type" (y-axis) and "Length" (x-axis). The color intensity of each cell represents the accuracy percentage, with a corresponding color bar legend on the right.
### Components/Axes
* **Title:** "Baseline - Core Generalization - Qwen-2.5 1.5B" (centered at the top).
* **Y-Axis (Vertical):** Labeled "Type". It contains 7 discrete categories, numbered 1 through 7 from top to bottom.
* **X-Axis (Horizontal):** Labeled "Length". It contains 20 discrete categories, numbered 0 through 19 from left to right.
* **Legend/Color Bar:** Located on the far right of the chart. It is a vertical gradient bar labeled "Accuracy (%)". The scale runs from 0 (lightest blue/white) at the bottom to 100 (darkest blue) at the top, with tick marks at 0, 20, 40, 60, 80, and 100.
* **Data Cells:** The main chart area is a grid where each cell's color corresponds to an accuracy value. The numerical accuracy percentage is printed in white text within each colored cell.
### Detailed Analysis
The following table reconstructs the data from the heatmap. Empty cells indicate no data point was recorded for that Type/Length combination.
| Type \ Length | 0 | 1 | 2 | 3 | 4 | 5 | 6 | 7 | 8 | 9 | 10 | 11 | 12 | 13 | 14 | 15 | 16 | 17 | 18 | 19 |
| :------------ | :-- | :-- | :-- | :-- | :-- | :-- | :-- | :-- | :-- | :-- | :-- | :-- | :-- | :-- | :-- | :-- | :-- | :-- | :-- | :-- |
| **1** | 100.0 | 88.7 | 92.3 | 80.7 | 76.7 | 72.7 | 71.7 | 75.7 | 73.0 | 77.3 | | | | | | | | | | |
| **2** | | 99.3 | 98.0 | 100.0 | 97.0 | 96.3 | 95.7 | 96.7 | 96.7 | 97.3 | 97.3 | | | | | | | | | |
| **3** | 100.0 | 97.7 | 94.0 | 90.3 | 86.7 | 80.0 | 75.3 | 76.3 | 77.0 | 77.3 | 73.0 | 77.3 | 69.7 | 75.3 | 79.0 | 75.3 | 72.0 | 78.3 | 76.7 | 71.3 |
| **4** | | 96.0 | 95.3 | 89.7 | 90.0 | 80.3 | 74.7 | 78.3 | 75.7 | 76.7 | 73.3 | 53.3 | | | | | | | | |
| **5** | | | | | | | | 69.3 | 72.3 | 71.0 | 83.3 | 77.3 | 79.7 | 76.7 | 79.7 | 71.3 | 79.7 | 74.7 | 70.7 | 77.3 |
| **6** | 100.0 | 100.0 | 99.0 | 98.0 | 98.3 | 97.7 | 98.7 | 98.0 | 96.0 | 96.3 | 96.3 | 94.3 | 93.7 | 95.3 | 94.7 | 91.7 | 95.3 | 94.7 | 93.3 | |
| **7** | 100.0 | 98.3 | 97.0 | 94.0 | 92.7 | 89.7 | 85.3 | 87.0 | 81.3 | 82.3 | 83.7 | 77.7 | 74.0 | 73.7 | | | | | | |
### Key Observations
1. **Performance Range:** Accuracy values range from a low of **53.3%** (Type 4, Length 11) to multiple perfect scores of **100.0%**.
2. **Type 6 Dominance:** Type 6 exhibits the strongest and most consistent performance, maintaining accuracy above 91.7% across all measured lengths (0-18). It starts at 100% and shows only a very gradual decline.
3. **Type 4 Anomaly:** Type 4 shows a significant performance drop at **Length 11 (53.3%)**, which is the lowest value in the entire dataset. This is a sharp outlier compared to its neighboring values (73.3% at Length 10 and no data after).
4. **Length Coverage:** Different "Types" are evaluated over different ranges of "Length":
* Types 1, 2, and 7 are evaluated for shorter lengths (0-9, 1-10, and 0-13 respectively).
* Types 3, 5, and 6 are evaluated for longer lengths (0-19, 7-19, and 0-18 respectively).
* Type 4 is evaluated for lengths 1-11.
5. **General Trend:** For most types, there is a general downward trend in accuracy as "Length" increases, though the rate of decline varies significantly by type. Type 6 is the most resilient to increasing length.
6. **Color Correlation:** The color gradient accurately reflects the numerical values. The darkest blue cells correspond to 100% or high-90s accuracy, while the lightest blue cell corresponds to the 53.3% value.
### Interpretation
This heatmap provides a diagnostic view of the Qwen-2.5 1.5B model's ability to generalize core tasks as a function of problem "Type" and "Length".
* **What the data suggests:** The model's generalization capability is highly dependent on the specific "Type" of task. It demonstrates robust, near-perfect performance on Type 6 across a wide range of lengths, suggesting this task type is well-learned or inherently easier for the model. Conversely, the dramatic failure of Type 4 at Length 11 indicates a specific weakness or a point where the task complexity exceeds the model's capacity for that particular type.
* **Relationship between elements:** The "Type" axis likely represents different categories or formulations of a core reasoning or generalization task. The "Length" axis likely represents the complexity or sequential length of the problem instance. The chart reveals an interaction effect: the impact of increasing length on accuracy is not uniform but is mediated by the task type.
* **Notable patterns and anomalies:**
* **The Type 4 Cliff:** The drop to 53.3% is the most salient anomaly. It could indicate a specific failure mode, a data distribution gap, or a threshold effect where the model's reasoning breaks down for that type at that specific length.
* **The Type 6 Plateau:** The sustained high performance of Type 6 is notable. It suggests the model has a strong, length-invariant representation for this task type.
* **Missing Data:** The staggered start and end points for different types (e.g., Type 5 starts at Length 7) imply the evaluation was designed to test types over their relevant or challenging length ranges, rather than a uniform grid.
In summary, the heatmap is a valuable tool for identifying model strengths (Type 6), weaknesses (Type 4 at Length 11), and the varying sensitivity of different task types to increasing problem length. It guides further investigation into why certain types generalize better than others.