# Technical Document Extraction: Heatmap Analysis
## Title
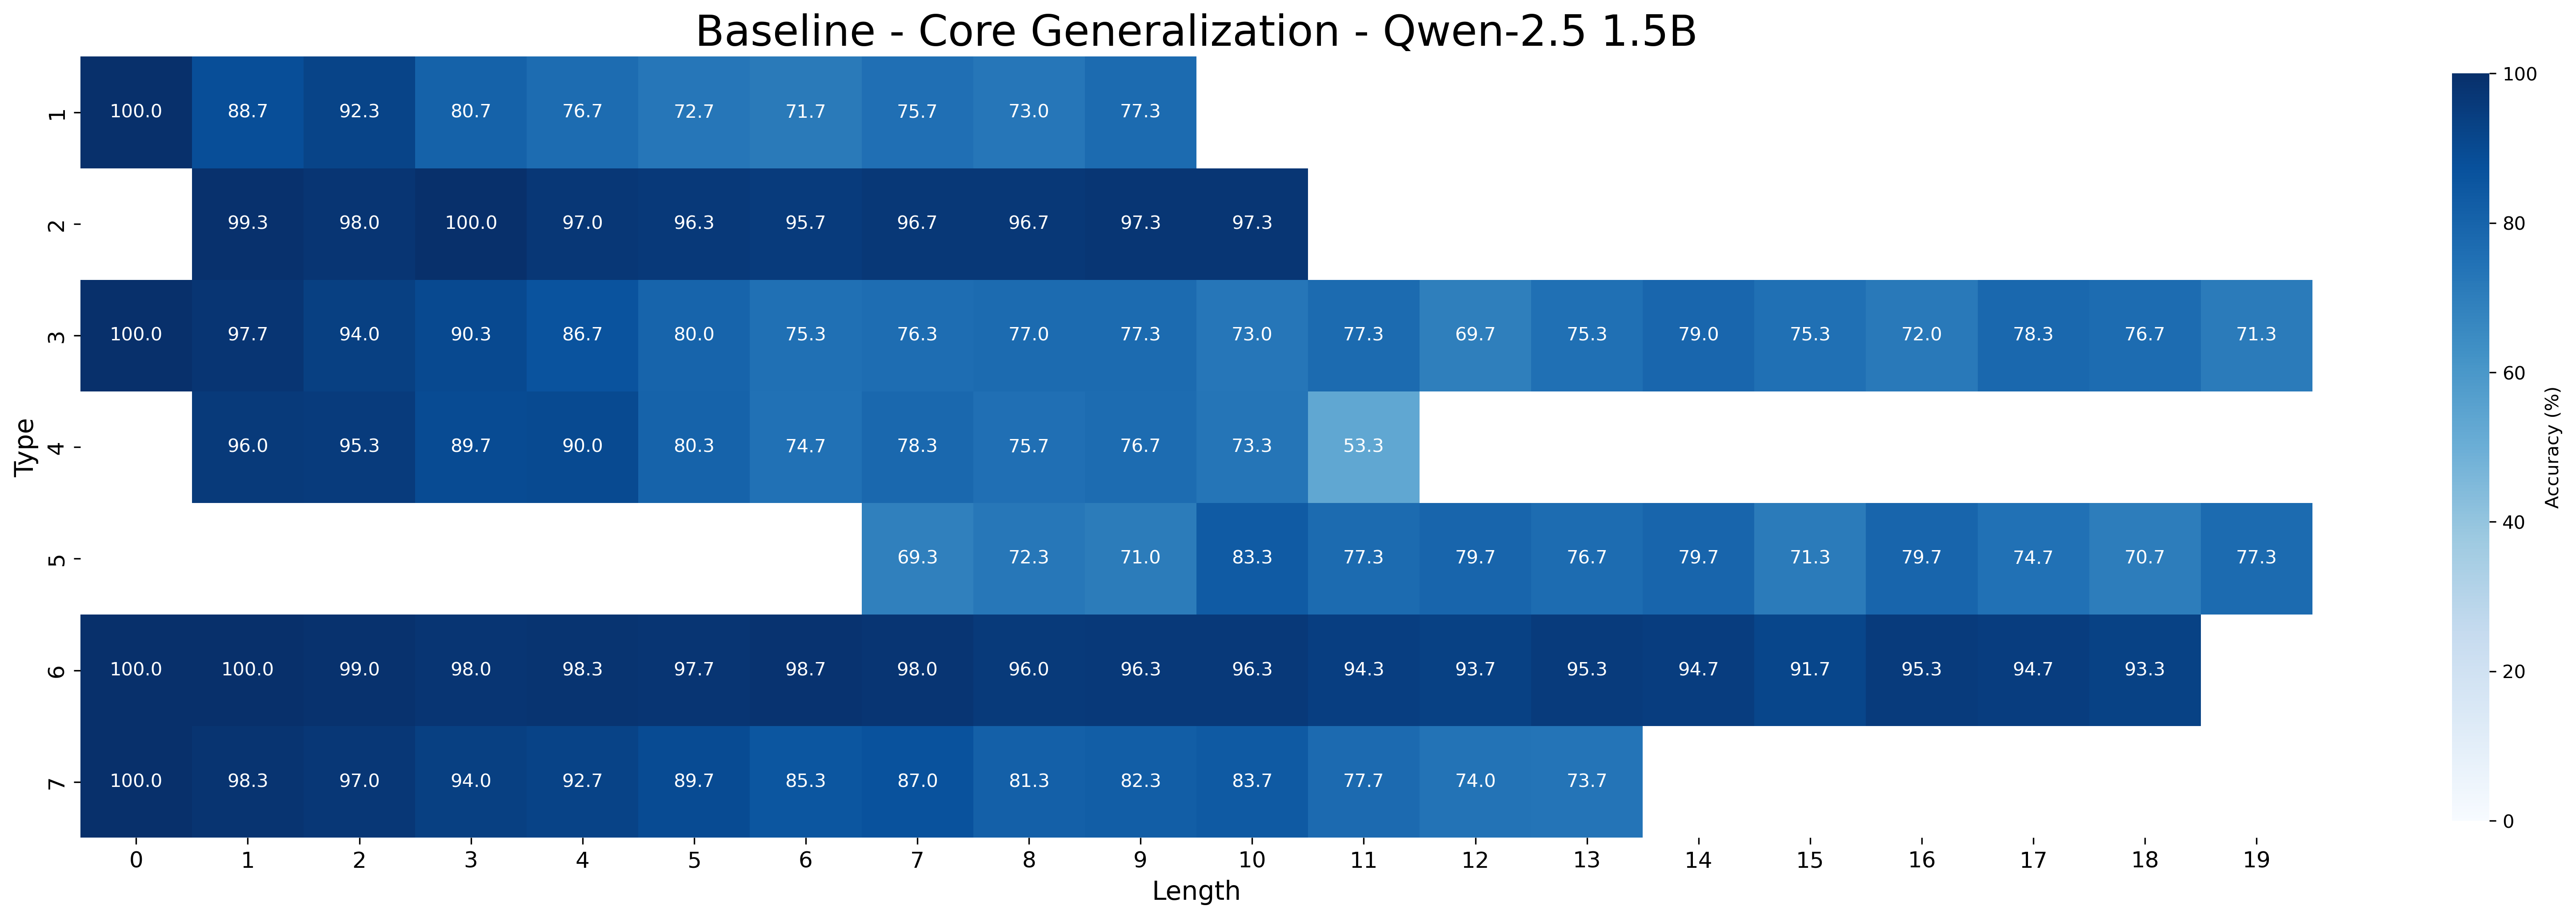
**Baseline - Core Generalization - Qwen-2.5 1.5B**
---
## Axes and Labels
- **X-Axis (Horizontal):**
- Label: `Length`
- Values: `0` to `19` (integer increments)
- Spatial Position: Bottom edge of heatmap
- **Y-Axis (Vertical):**
- Label: `Type`
- Values: `1` to `7` (integer increments)
- Spatial Position: Left edge of heatmap
- **Colorbar (Legend):**
- Label: `Accuracy (%)`
- Range: `0%` (lightest blue) to `100%` (darkest blue)
- Spatial Position: Right edge of heatmap
---
## Heatmap Structure
- **Rows:** 7 (Types 1–7)
- **Columns:** 20 (Lengths 0–19)
- **Cell Values:** Accuracy percentages (e.g., `100.0`, `88.7`, `92.3`, etc.)
---
## Data Table Reconstruction
| Type \ Length | 0 | 1 | 2 | 3 | 4 | 5 | 6 | 7 | 8 | 9 | 10 | 11 | 12 | 13 | 14 | 15 | 16 | 17 | 18 | 19 |
|---------------|-------|-------|-------|-------|-------|-------|-------|-------|-------|-------|-------|-------|-------|-------|-------|-------|-------|-------|-------|-------|
| **1** | 100.0 | 88.7 | 92.3 | 80.7 | 76.7 | 72.7 | 71.7 | 75.7 | 73.0 | 77.3 | | | | | | | | | | |
| **2** | | 99.3 | 98.0 | 100.0 | 97.0 | 96.3 | 95.7 | 96.7 | 96.7 | 97.3 | 97.3 | | | | | | | | | |
| **3** | 100.0 | 97.7 | 94.0 | 90.3 | 86.7 | 80.0 | 75.3 | 76.3 | 77.0 | 77.3 | 73.0 | 77.3 | 69.7 | 75.3 | 79.0 | 75.3 | 72.0 | 78.3 | 76.7 | 71.3 |
| **4** | | 96.0 | 95.3 | 89.7 | 90.0 | 80.3 | 74.7 | 78.3 | 75.7 | 76.7 | 73.3 | 53.3 | | | | | | | | |
| **5** | | | | | | | | 69.3 | 72.3 | 71.0 | 83.3 | 77.3 | 79.7 | 76.7 | 79.7 | 71.3 | 79.7 | 74.7 | 70.7 | 77.3 |
| **6** | 100.0 | 100.0 | 99.0 | 98.0 | 98.3 | 97.7 | 98.7 | 98.0 | 96.0 | 96.3 | 96.3 | 94.3 | 93.7 | 95.3 | 94.7 | 91.7 | 95.3 | 94.7 | 93.3 | |
| **7** | 100.0 | 98.3 | 97.0 | 94.0 | 92.7 | 89.7 | 85.3 | 87.0 | 81.3 | 82.3 | 83.7 | 77.7 | 74.0 | 73.7 | | | | | | |
---
## Key Trends
1. **General Pattern:**
- Accuracy decreases as `Length` increases for most `Type` values.
- Exceptions:
- Type 6 maintains high accuracy (90%+) until `Length=18`, then drops sharply.
- Type 5 shows a peak at `Length=10` (83.3%) before declining.
2. **Type-Specific Observations:**
- **Type 1:** Steady decline from 100% (Length 0) to 71.3% (Length 19).
- **Type 2:** High accuracy (97–99%) until `Length=10`, then gradual decline.
- **Type 3:** Moderate decline (100% → 71.3%) with minor fluctuations.
- **Type 4:** Sharp drop at `Length=11` (53.3%), lowest among all types.
- **Type 5:** Bimodal pattern (low at `Length=7`, peak at `Length=10`).
- **Type 6:** Near-perfect accuracy until `Length=18`, then drops to 77.3%.
- **Type 7:** Gradual decline (100% → 73.7%) with no sharp drops.
---
## Spatial Grounding
- **Legend Placement:** Right edge, spanning full height of heatmap.
- **Title Placement:** Centered at the top of the heatmap.
- **Axis Alignment:**
- X-axis labels centered below columns.
- Y-axis labels left-aligned along rows.
---
## Color Consistency Check
- **Dark Blue Cells:** Correspond to values ≥90% (e.g., Type 6, Length 0–18).
- **Light Blue Cells:** Correspond to values ≤70% (e.g., Type 4, Length 11).
- **Mid-Range Blue:** Values between 70–90% (e.g., Type 3, Length 6–10).
---
## Additional Notes
- **Missing Data:**
- Cells with no values (e.g., Type 1, Length 14–19) are visually empty.
- Assumed to represent non-applicable or undefined data points.
- **Language:** All text is in English. No non-English content detected.
---
## Summary
This heatmap visualizes the accuracy of core generalization across 7 types and 20 lengths for the Qwen-2.5 1.5B model. Accuracy trends show a general decline with increasing length, with notable exceptions for Types 4, 5, and 6. The colorbar provides a clear mapping of accuracy percentages to visual intensity.