# Technical Document Extraction: Student Feedback Survey Results
## 1. Component Isolation
* **Header (Legend):** Located at the top of the image, spanning the width of the chart. It defines five Likert-scale categories with associated colors.
* **Main Chart (Body):** A horizontal stacked bar chart showing five distinct survey questions/statements on the Y-axis and percentages on the X-axis.
* **Footer (X-Axis Label):** Located at the bottom, defining the unit of measurement.
---
## 2. Legend Data (Spatial Grounding: Top Center)
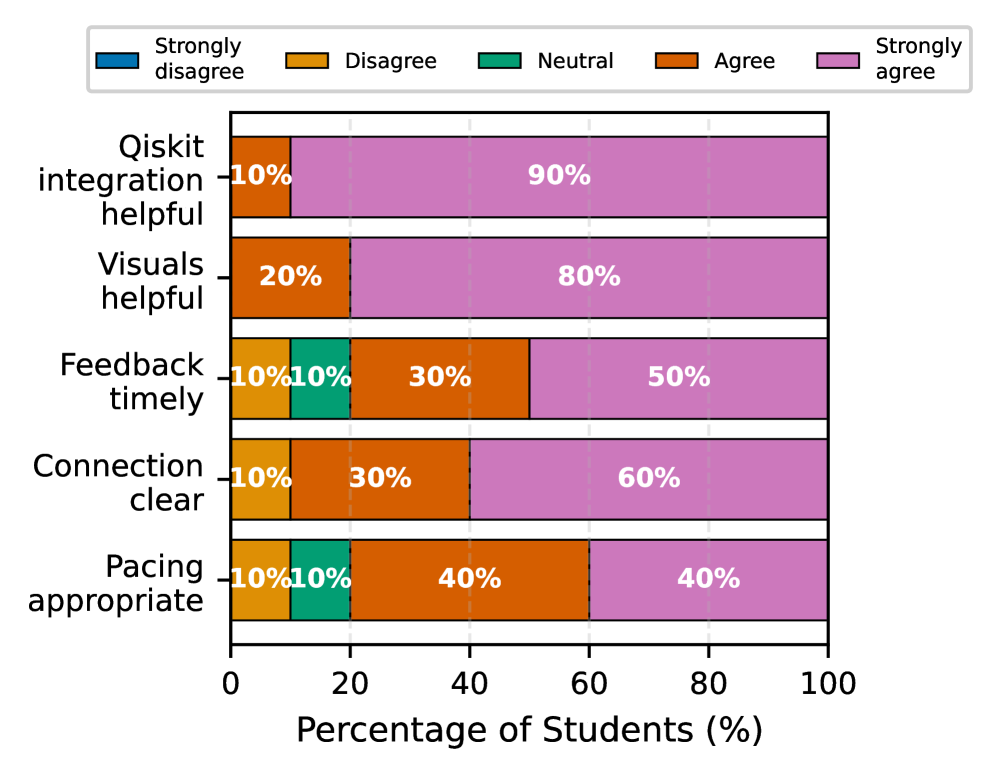
The legend maps colors to sentiment levels. The categories are ordered from negative to positive sentiment (left to right):
| Color | Label |
| :--- | :--- |
| **Dark Blue** | Strongly disagree |
| **Golden Yellow** | Disagree |
| **Teal Green** | Neutral |
| **Burnt Orange** | Agree |
| **Lavender/Pink** | Strongly agree |
---
## 3. Chart Data Extraction
The chart displays the "Percentage of Students (%)" on the X-axis, ranging from 0 to 100 with markers every 20 units.
### Data Table Reconstruction
| Survey Statement (Y-Axis) | Strongly disagree (Blue) | Disagree (Yellow) | Neutral (Teal) | Agree (Orange) | Strongly agree (Pink) |
| :--- | :---: | :---: | :---: | :---: | :---: |
| **Qiskit integration helpful** | 0% | 0% | 0% | 10% | 90% |
| **Visuals helpful** | 0% | 0% | 0% | 20% | 80% |
| **Feedback timely** | 0% | 10% | 10% | 30% | 50% |
| **Connection clear** | 0% | 10% | 0% | 30% | 60% |
| **Pacing appropriate** | 0% | 10% | 10% | 40% | 40% |
---
## 4. Trend Verification and Analysis
### Overall Sentiment
The visual trend across all five categories is heavily skewed toward the right (positive sentiment). The "Strongly agree" (Pink) and "Agree" (Orange) segments dominate every bar, while "Strongly disagree" (Blue) is entirely absent (0%) from all responses.
### Category Specifics
1. **Qiskit integration helpful:** This item received the highest satisfaction rating, with 100% positive sentiment (90% Strongly agree, 10% Agree).
2. **Visuals helpful:** Highly positive, with 100% of students agreeing or strongly agreeing (80% Strongly agree).
3. **Connection clear:** Shows 90% total agreement, with a small 10% "Disagree" segment. Notably, there were no "Neutral" responses for this item.
4. **Feedback timely:** Shows 80% total agreement. This item, along with "Pacing," has the highest diversity of opinion, including 10% Neutral and 10% Disagree.
5. **Pacing appropriate:** While still majority positive (80% total agreement), this item has the lowest "Strongly agree" percentage (40%) and the highest "Agree" percentage (40%), suggesting pacing is the most varied experience among students.
---
## 5. Axis and Labels
* **X-Axis Title:** Percentage of Students (%)
* **X-Axis Markers:** 0, 20, 40, 60, 80, 100
* **Y-Axis Labels (Statements):**
* Qiskit integration helpful
* Visuals helpful
* Feedback timely
* Connection clear
* Pacing appropriate