## Density Contour Plots: Comparing Text Embeddings
### Overview
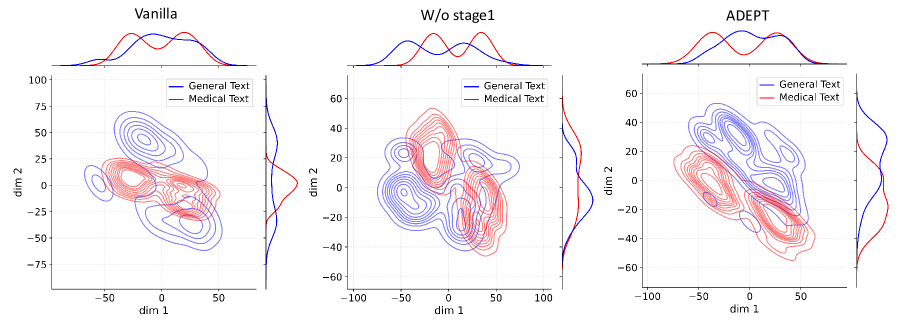
The image presents three sets of density contour plots, each comparing the distribution of "General Text" and "Medical Text" embeddings in a two-dimensional space. The plots are arranged horizontally, labeled "Vanilla," "W/o stage1," and "ADEPT." Each plot includes a 2D contour plot, a density plot above it representing the distribution along the horizontal axis (dim 1), and a density plot to the right representing the distribution along the vertical axis (dim 2). The plots aim to visualize how different embedding methods separate general and medical text.
### Components/Axes
* **Titles:** "Vanilla," "W/o stage1," "ADEPT" (placed above each respective plot).
* **Legends:** Each plot has a legend in the top-left corner indicating:
* "General Text" (represented by the color blue)
* "Medical Text" (represented by the color red)
* **Axes Labels:**
* Horizontal axis (dim 1): Ranges from approximately -75 to 75 for "Vanilla", -100 to 100 for "W/o stage1", and -100 to 100 for "ADEPT".
* Vertical axis (dim 2): Ranges from approximately -75 to 100 for "Vanilla", -60 to 60 for "W/o stage1", and -60 to 60 for "ADEPT".
* **Axis Markers:**
* Vanilla: dim 1: -50, 0, 50. dim 2: -75, -50, -25, 0, 25, 50, 75, 100
* W/o stage1: dim 1: -100, -50, 0, 50, 100. dim 2: -60, -40, -20, 0, 20, 40, 60
* ADEPT: dim 1: -100, -50, 0, 50. dim 2: -60, -40, -20, 0, 20, 40, 60
### Detailed Analysis
**1. Vanilla:**
* **2D Contour Plot:**
* "General Text" (blue): The contours form a cluster centered around dim 1 = -25 and dim 2 = 25. The distribution is somewhat elongated along a diagonal.
* "Medical Text" (red): The contours form a cluster centered around dim 1 = 25 and dim 2 = -10. The distribution is more spread out compared to "General Text."
* **Horizontal Density Plot (dim 1):**
* "General Text" (blue): Shows a single peak around -25.
* "Medical Text" (red): Shows a single peak around 25.
* **Vertical Density Plot (dim 2):**
* "General Text" (blue): Shows a single peak around 25.
* "Medical Text" (red): Shows a single peak around -10.
**2. W/o stage1:**
* **2D Contour Plot:**
* "General Text" (blue): The contours are more dispersed, with a primary cluster around dim 1 = -25 and dim 2 = 10, and a secondary cluster around dim 1 = 25 and dim 2 = -20.
* "Medical Text" (red): The contours are also dispersed, with a primary cluster around dim 1 = 25 and dim 2 = 10, and a secondary cluster around dim 1 = -25 and dim 2 = -20. There is significant overlap between the two distributions.
* **Horizontal Density Plot (dim 1):**
* "General Text" (blue): Shows two peaks, one around -25 and another around 25.
* "Medical Text" (red): Shows two peaks, one around -25 and another around 25.
* **Vertical Density Plot (dim 2):**
* "General Text" (blue): Shows two peaks, one around 10 and another around -20.
* "Medical Text" (red): Shows two peaks, one around 10 and another around -20.
**3. ADEPT:**
* **2D Contour Plot:**
* "General Text" (blue): The contours form a cluster centered around dim 1 = -40 and dim 2 = 20.
* "Medical Text" (red): The contours form a cluster centered around dim 1 = 40 and dim 2 = -20. The separation between the two distributions is more pronounced than in the other two plots.
* **Horizontal Density Plot (dim 1):**
* "General Text" (blue): Shows a single peak around -40.
* "Medical Text" (red): Shows a single peak around 40.
* **Vertical Density Plot (dim 2):**
* "General Text" (blue): Shows a single peak around 20.
* "Medical Text" (red): Shows a single peak around -20.
### Key Observations
* The "Vanilla" plot shows some separation between "General Text" and "Medical Text," but there is still some overlap.
* The "W/o stage1" plot shows significant overlap between the two distributions, indicating poor separation.
* The "ADEPT" plot shows the best separation between "General Text" and "Medical Text," with distinct clusters for each.
### Interpretation
The plots visualize the effectiveness of different embedding methods in distinguishing between general and medical text. The "ADEPT" method appears to be the most effective, as it produces the most distinct clusters for the two types of text. Removing "stage1" results in the worst separation. The "Vanilla" method provides an intermediate level of separation. This suggests that the "ADEPT" method is better at capturing the semantic differences between general and medical text, which could be beneficial for various natural language processing tasks in the medical domain. The overlap in "W/o stage1" suggests that stage 1 is critical for separating the two types of text.