## 2D Contour Plots: Text Embedding Distributions Across Methods
### Overview
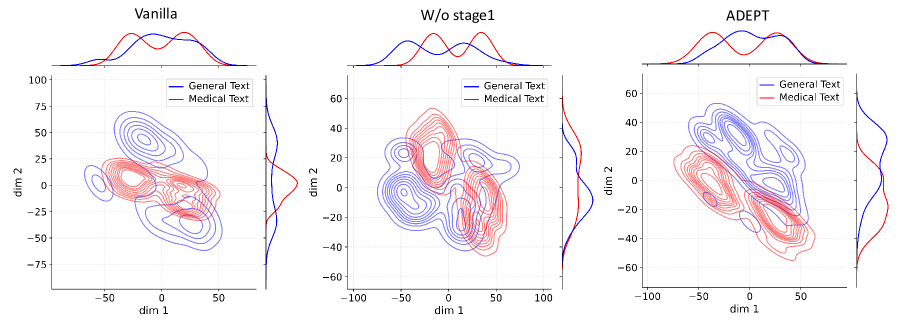
The image presents three comparative 2D contour plots visualizing the latent space distributions of General Text (blue) and Medical Text (red) across three different model configurations: Vanilla, W/o stage1, and ADEPT. Each subplot includes marginal histograms showing 1D projections along dim1 (top) and dim2 (right).
### Components/Axes
- **X-axis (dim1)**: Ranges from -100 to 100 across subplots
- **Y-axis (dim2)**: Ranges from -75 to 75 (Vanilla), -60 to 60 (W/o stage1), and -60 to 60 (ADEPT)
- **Legend**:
- Blue = General Text
- Red = Medical Text
- **Marginal Histograms**:
- Top: dim1 distribution
- Right: dim2 distribution
- **Contour Lines**:
- Blue (General Text) and Red (Medical Text) distributions
- Density indicated by line thickness
### Detailed Analysis
#### Vanilla
- **Contour Spread**:
- General Text (blue): -50 to 50 (dim1), -75 to 25 (dim2)
- Medical Text (red): -30 to 30 (dim1), -50 to 0 (dim2)
- **Overlap**: Significant overlap in central region (-10 to 10 dim1, -25 to 0 dim2)
- **Histograms**:
- dim1: Bimodal peaks at ±30
- dim2: Single peak at 0
#### W/o stage1
- **Contour Spread**:
- General Text (blue): -100 to 100 (dim1), -40 to 40 (dim2)
- Medical Text (red): -60 to 60 (dim1), -30 to 30 (dim2)
- **Overlap**: Moderate overlap in central region (-20 to 20 dim1, -10 to 10 dim2)
- **Histograms**:
- dim1: Single peak at 0
- dim2: Bimodal peaks at ±20
#### ADEPT
- **Contour Spread**:
- General Text (blue): -80 to 80 (dim1), -40 to 40 (dim2)
- Medical Text (red): -50 to 50 (dim1), -30 to 30 (dim2)
- **Overlap**: Minimal overlap in central region (-10 to 10 dim1, -10 to 10 dim2)
- **Histograms**:
- dim1: Single peak at 0
- dim2: Single peak at 0
### Key Observations
1. **ADEPT** shows the clearest separation between text types, with Medical Text (red) forming a tighter cluster
2. **Vanilla** exhibits the most overlap, with Medical Text distribution heavily concentrated in negative dim2
3. **W/o stage1** demonstrates intermediate separation with broader dim1 spread
4. All methods show Medical Text with stronger dim2 concentration than General Text
5. ADEPT's dim1 range is 60% narrower than Vanilla while maintaining similar dim2 spread
### Interpretation
The progressive improvement in text type separation from Vanilla → W/o stage1 → ADEPT suggests that the stage1 component plays a critical role in disentangling text representations. ADEPT's tighter clustering of Medical Text (red) indicates better feature discrimination, potentially improving downstream task performance. The reduced dim1 spread in ADEPT compared to Vanilla suggests more efficient use of latent dimensions. The consistent dim2 concentration across methods implies this dimension primarily captures text-type specific features. The marginal histograms reveal that ADEPT achieves more balanced distributions across both dimensions compared to other configurations.