## Convolutional Neural Network Layer Diagram
### Overview
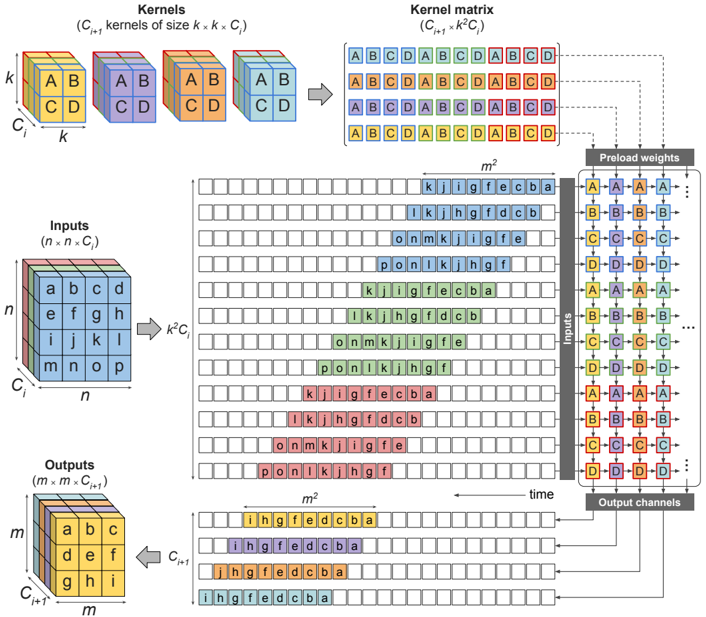
The image is a diagram illustrating the process of convolution in a convolutional neural network (CNN) layer. It shows how input data, kernels, and weights interact to produce output channels. The diagram visualizes the transformation of input features through convolution operations, highlighting the spatial relationships and data flow within the layer.
### Components/Axes
* **Kernels (C<sub>i+1</sub> kernels of size k x k x C<sub>i</sub>):** Four 3D cubes, each representing a kernel. Each cube is divided into 8 smaller cubes, with labels "A", "B", "C", and "D" on the faces. The dimensions are labeled as 'k', 'k', and 'C<sub>i</sub>'.
* **Kernel matrix (C<sub>i+1</sub> x k<sup>2</sup>C<sub>i</sub>):** A matrix formed by arranging the kernel elements. It shows the repeating sequence of "ABCD" in each row.
* **Inputs (n x n x C<sub>i</sub>):** A 3D cube representing the input data. The dimensions are labeled as 'n', 'n', and 'C<sub>i</sub>'. The cube's faces are labeled with letters 'a' through 'p'.
* **Outputs (m x m x C<sub>i+1</sub>):** A 3D cube representing the output data. The dimensions are labeled as 'm', 'm', and 'C<sub>i+1</sub>'. The cube's faces are labeled with letters 'a' through 'i'.
* **Preload weights:** A column of blocks labeled "Inputs", each containing four sub-blocks labeled "A", "B", "C", and "D". These blocks are connected to the "Kernel matrix" via dashed lines.
* **Output channels:** A column of blocks representing the output channels, each containing four sub-blocks.
* **m<sup>2</sup>:** Indicates the number of rows in the intermediate matrices.
* **k<sup>2</sup>C<sub>i</sub>:** Indicates the transformation from the input cube to the intermediate matrix.
* **Time:** An arrow indicating the direction of processing.
### Detailed Analysis
1. **Kernels:**
* Four kernel cubes are shown, each with dimensions k x k x C<sub>i</sub>.
* Each kernel cube has faces labeled with "A", "B", "C", and "D".
* The colors of the cubes are blue, purple, orange, and green.
2. **Kernel Matrix:**
* The kernel matrix is formed by arranging the elements of the kernels.
* Each row of the matrix contains a repeating sequence of "ABCD".
* The matrix has dimensions C<sub>i+1</sub> x k<sup>2</sup>C<sub>i</sub>.
3. **Inputs:**
* The input data is represented as a 3D cube with dimensions n x n x C<sub>i</sub>.
* The faces of the cube are labeled with letters 'a' through 'p'.
4. **Outputs:**
* The output data is represented as a 3D cube with dimensions m x m x C<sub>i+1</sub>.
* The faces of the cube are labeled with letters 'a' through 'i'.
5. **Intermediate Matrices:**
* Several matrices are shown between the "Inputs" and "Outputs".
* Each row of these matrices contains a sequence of letters, such as "kjigfecba", "lkhgfdcb", "onmkjiigfe", and "ponlkjhgf".
* The number of rows in these matrices is indicated as m<sup>2</sup>.
6. **Preload Weights:**
* The "Preload weights" column shows blocks labeled "A", "B", "C", and "D".
* These blocks are connected to the "Kernel matrix" via dashed lines, indicating the application of weights to the kernel elements.
7. **Output Channels:**
* The "Output channels" column shows blocks representing the final output.
* Each block contains four sub-blocks, similar to the "Preload weights".
### Key Observations
* The diagram illustrates the flow of data from the input cube through the convolution operation to the output cube.
* The kernel matrix represents the weights applied during the convolution.
* The intermediate matrices show the result of applying the kernels to different regions of the input data.
* The "Preload weights" and "Output channels" columns highlight the role of weights in the convolution process.
### Interpretation
The diagram provides a visual representation of the convolution operation in a CNN layer. It demonstrates how the input data is transformed by applying kernels and weights to produce output features. The diagram highlights the spatial relationships between the input data, kernels, and output features. The use of intermediate matrices helps to visualize the intermediate steps in the convolution process. The diagram suggests that the convolution operation involves sliding the kernels across the input data, applying weights to the kernel elements, and summing the results to produce the output features. The diagram also shows how multiple kernels can be used to produce multiple output channels.