## Flowchart Diagram: XAI Techniques
### Overview
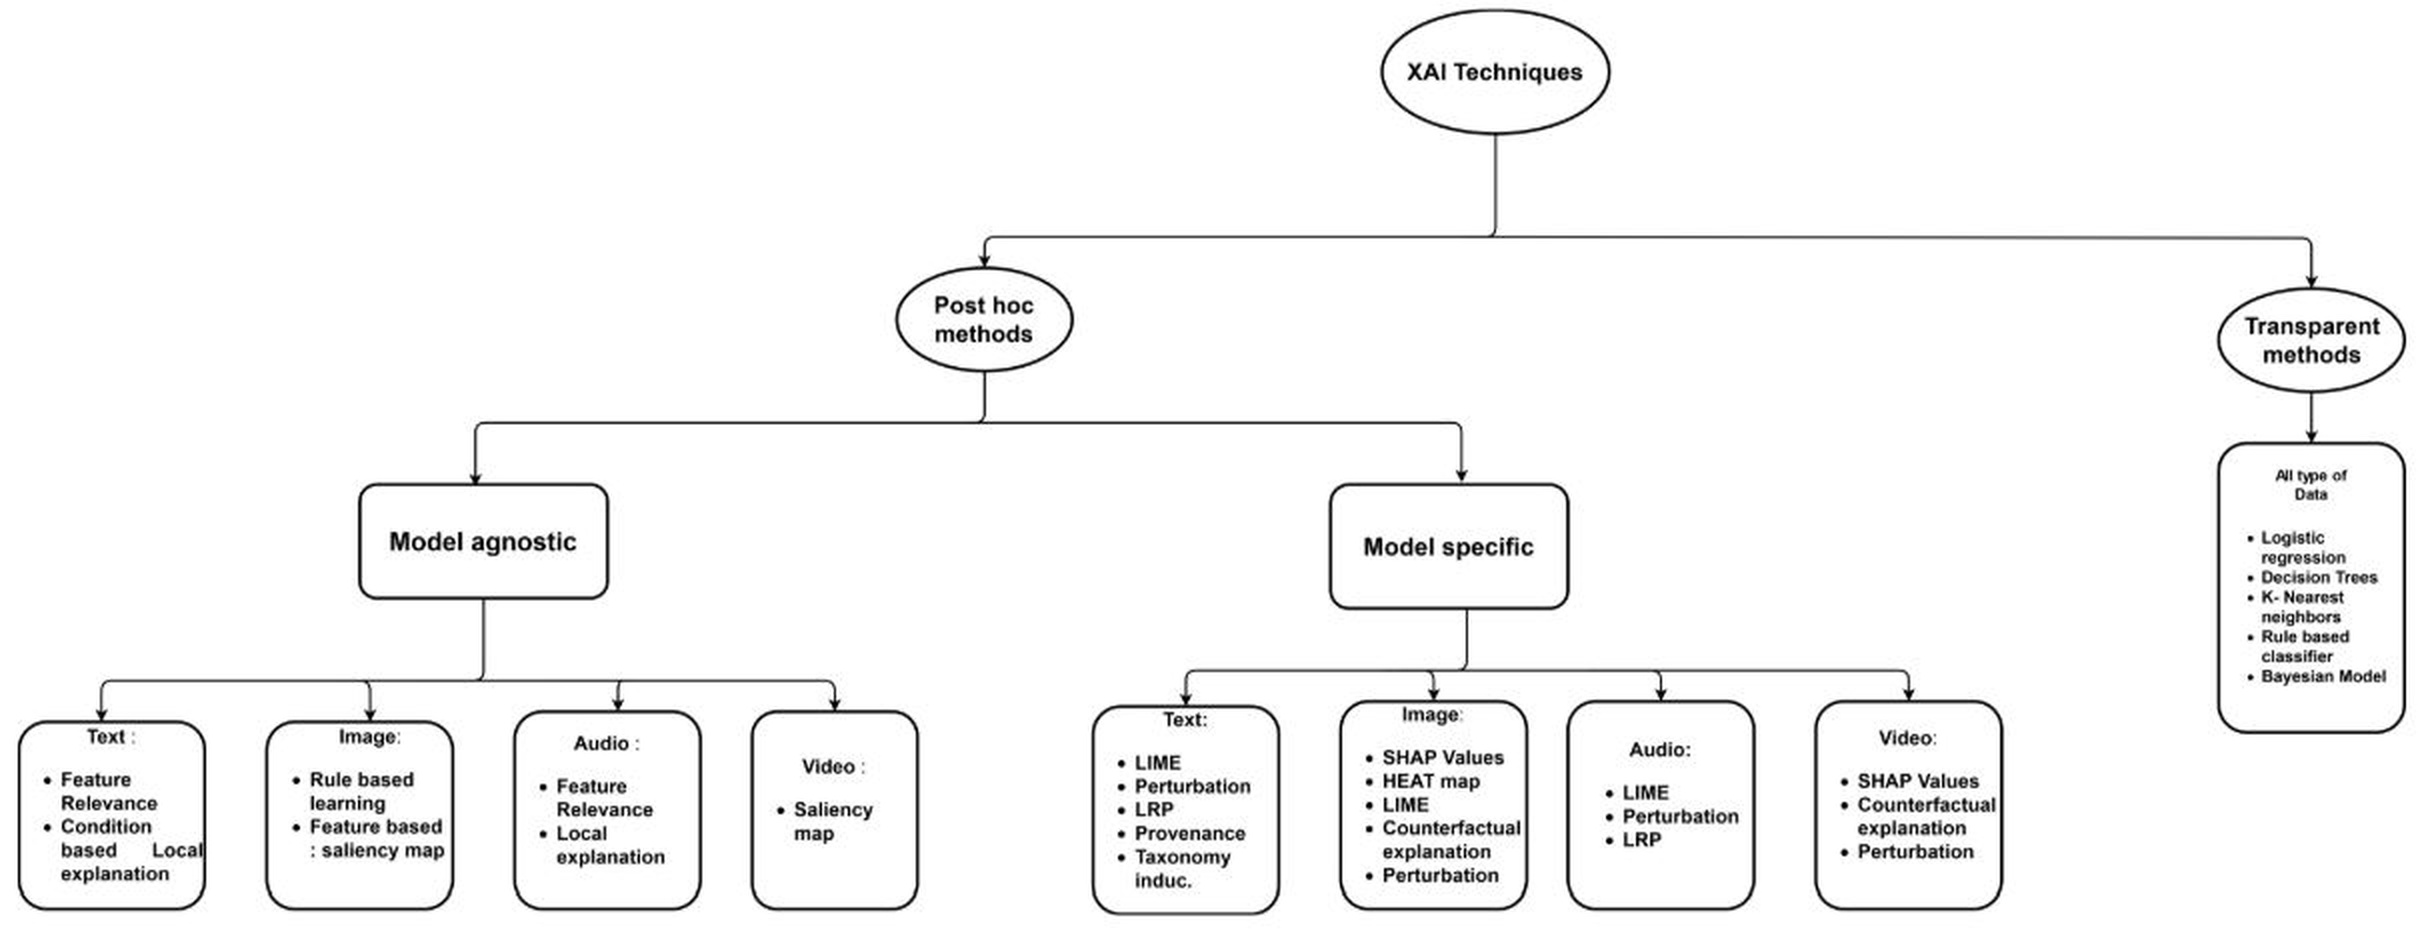
The diagram categorizes Explainable AI (XAI) techniques into two primary branches: **Post hoc methods** and **Transparent methods**. Each branch further subdivides into specific methodologies tailored to different data types (Text, Image, Audio, Video) and model-specific approaches.
### Components/Axes
- **Main Title**: "XAI Techniques" (central top node).
- **Primary Branches**:
- **Post hoc methods** (left branch from title).
- **Transparent methods** (right branch from title).
- **Subcategories**:
- **Post hoc methods**:
- **Model agnostic** (left sub-branch).
- **Model specific** (right sub-branch).
- **Transparent methods**: List of techniques under "All type of Data."
### Detailed Analysis
#### Post hoc methods
1. **Model agnostic**:
- **Text**:
- Feature Relevance
- Condition-based Local explanation
- **Image**:
- Rule-based learning
- Feature-based saliency map
- **Audio**:
- Feature Relevance
- Local explanation
- **Video**:
- Saliency map
2. **Model specific**:
- **Text**:
- LIME
- Perturbation
- LRP
- Provenance
- Taxonomy induc.
- **Image**:
- SHAP Values
- HEAT map
- LIME
- Counterfactual explanation
- Perturbation
- **Audio**:
- LIME
- Perturbation
- LRP
- **Video**:
- SHAP Values
- Counterfactual explanation
- Perturbation
#### Transparent methods
- **All type of Data**:
- Logistic regression
- Decision Trees
- K-Nearest neighbors
- Rule-based classifier
- Bayesian Model
### Key Observations
- **Hierarchical Structure**: The diagram emphasizes a top-down flow, starting with broad XAI categories and narrowing into specific techniques.
- **Data-Type Specificity**: Both Post hoc and Transparent methods are further divided by data type (Text, Image, Audio, Video), indicating tailored approaches for different modalities.
- **Technique Overlap**: Some methods (e.g., LIME, Perturbation) appear in both Model agnostic and Model specific categories, suggesting versatility across contexts.
- **Transparency Focus**: Transparent methods are presented as standalone techniques applicable to all data types, contrasting with the Post hoc approach's dependency on model type.
### Interpretation
The diagram illustrates the dual paradigms of XAI:
1. **Post hoc methods** prioritize model-agnostic or model-specific explanations after the fact, often relying on data-type-specific tools (e.g., saliency maps for images, LIME for text).
2. **Transparent methods** represent inherently interpretable models (e.g., Decision Trees, Logistic Regression) that do not require post-hoc explanation.
This structure highlights the trade-off between model complexity and interpretability, with Post hoc methods offering flexibility for complex models at the cost of added explanation layers, while Transparent methods provide simplicity but may lack the sophistication of advanced models. The inclusion of techniques like SHAP and LIME underscores the importance of feature attribution in modern XAI workflows.