## Pie Charts: ProofWriter and LogicNLI
### Overview
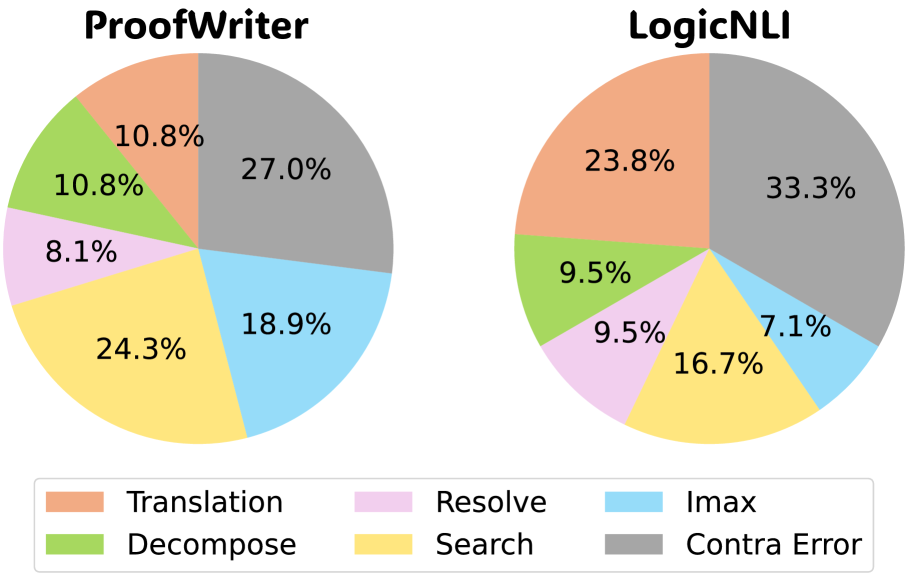
The image contains two side-by-side pie charts labeled "ProofWriter" (left) and "LogicNLI" (right). Each chart visually represents the distribution of six categories (Translation, Resolve, Imax, Decompose, Search, Contra Error) as percentages of a whole. A shared legend at the bottom maps colors to categories.
### Components/Axes
- **Legend**:
- **Translation**: Orange
- **Resolve**: Pink
- **Imax**: Light Blue
- **Decompose**: Green
- **Search**: Yellow
- **Contra Error**: Gray
- **Labels**:
- Left chart: "ProofWriter"
- Right chart: "LogicNLI"
- **Axes**:
- No explicit axes; percentages are embedded in segments.
### Detailed Analysis
#### ProofWriter (Left Chart)
- **Translation**: 10.8% (orange)
- **Resolve**: 8.1% (pink)
- **Imax**: 18.9% (light blue)
- **Decompose**: 10.8% (green)
- **Search**: 24.3% (yellow)
- **Contra Error**: 27.0% (gray)
#### LogicNLI (Right Chart)
- **Translation**: 23.8% (orange)
- **Resolve**: 9.5% (pink)
- **Imax**: 7.1% (light blue)
- **Decompose**: 9.5% (green)
- **Search**: 16.7% (yellow)
- **Contra Error**: 33.3% (gray)
### Key Observations
1. **Dominance of Contra Error**:
- In both charts, "Contra Error" occupies the largest segment (27.0% in ProofWriter, 33.3% in LogicNLI).
2. **Translation Focus in LogicNLI**:
- "Translation" is the second-largest category in LogicNLI (23.8%), significantly higher than in ProofWriter (10.8%).
3. **Search vs. Imax**:
- "Search" is the largest non-Contra Error category in ProofWriter (24.3%) but smaller in LogicNLI (16.7%).
- "Imax" is the smallest category in LogicNLI (7.1%) but larger in ProofWriter (18.9%).
4. **Symmetry in ProofWriter**:
- "Resolve," "Decompose," and "Translation" have identical percentages (8.1%, 10.8%, 10.8%), suggesting balanced emphasis.
### Interpretation
The data highlights systemic differences in prioritization between ProofWriter and LogicNLI:
- **ProofWriter** emphasizes **Search** and **Contra Error** most heavily, with moderate focus on **Imax**. Other categories are relatively minor.
- **LogicNLI** prioritizes **Contra Error** even more strongly, with **Translation** becoming a major focus (23.8%), surpassing all other categories except Contra Error.
- The smaller percentages for **Resolve**, **Decompose**, and **Imax** in LogicNLI suggest these tasks are deprioritized compared to ProofWriter.
- The stark contrast in "Translation" allocation (10.8% vs. 23.8%) implies LogicNLI may specialize in translation-related error detection or correction.
This analysis assumes the percentages reflect intentional design choices or observed usage patterns, though the exact rationale for category weighting is not provided in the image.