\n
## Pie Charts: ProofWriter and LogicNLI Dataset Error Distributions
### Overview
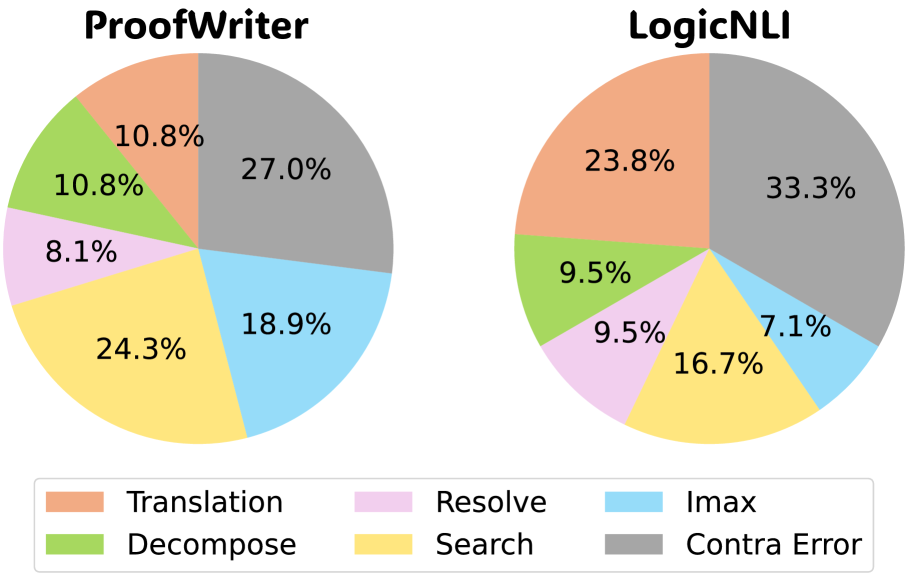
The image displays two pie charts side-by-side, comparing the distribution of error types or reasoning steps across two different datasets or models named "ProofWriter" and "LogicNLI". A shared legend at the bottom defines six categories. The charts are presented on a plain white background.
### Components/Axes
* **Chart Titles:** "ProofWriter" (left chart), "LogicNLI" (right chart). Both are in bold, black, sans-serif font.
* **Legend:** Positioned at the bottom center of the image. It contains six colored squares with corresponding labels:
* Orange square: `Translation`
* Green square: `Decompose`
* Pink square: `Resolve`
* Yellow square: `Search`
* Blue square: `Imax`
* Gray square: `Contra Error`
* **Data Representation:** Each pie chart is divided into six colored segments, each labeled with a percentage value. The segments correspond to the categories in the legend.
### Detailed Analysis
**ProofWriter Chart (Left):**
* **Contra Error (Gray):** 27.0% - The largest segment, located in the top-right quadrant.
* **Search (Yellow):** 24.3% - The second-largest segment, located in the bottom-left quadrant.
* **Imax (Blue):** 18.9% - Located in the bottom-right quadrant.
* **Translation (Orange):** 10.8% - Located in the top-left quadrant.
* **Decompose (Green):** 10.8% - Located in the left-center, adjacent to Translation.
* **Resolve (Pink):** 8.1% - The smallest segment, located between Decompose and Search.
**LogicNLI Chart (Right):**
* **Contra Error (Gray):** 33.3% - The largest segment, located in the top-right quadrant.
* **Translation (Orange):** 23.8% - The second-largest segment, located in the top-left quadrant.
* **Search (Yellow):** 16.7% - Located in the bottom-left quadrant.
* **Decompose (Green):** 9.5% - Located in the left-center.
* **Resolve (Pink):** 9.5% - Located between Decompose and Search.
* **Imax (Blue):** 7.1% - The smallest segment, located in the bottom-right quadrant.
### Key Observations
1. **Dominant Category:** "Contra Error" is the largest category in both datasets, comprising over a quarter of the distribution in ProofWriter (27.0%) and a third in LogicNLI (33.3%).
2. **Significant Shifts:**
* The "Translation" category is more than twice as prevalent in LogicNLI (23.8%) compared to ProofWriter (10.8%).
* The "Imax" category shows the opposite trend, being significantly larger in ProofWriter (18.9%) than in LogicNLI (7.1%).
3. **Similar Proportions:** The "Decompose" and "Resolve" categories have similar, relatively small proportions in both charts (10.8%/8.1% in ProofWriter, 9.5%/9.5% in LogicNLI).
4. **Rank Order Change:** The order of the second and third largest categories differs between the charts. In ProofWriter, it is Search (24.3%) then Imax (18.9%). In LogicNLI, it is Translation (23.8%) then Search (16.7%).
### Interpretation
The data suggests a fundamental difference in the error or reasoning step profiles between the ProofWriter and LogicNLI datasets or the models evaluated on them.
* The consistently high proportion of **"Contra Error"** indicates that handling contradictions or counterfactual reasoning is a major challenge across both contexts.
* The stark contrast in **"Translation"** and **"Imax"** proportions is the most notable finding. This implies that the LogicNLI task involves significantly more challenges related to translating or interpreting natural language into a formal representation ("Translation"), while the ProofWriter task involves more challenges related to a process or metric labeled "Imax" (potentially related to maximization or inference depth).
* The relative stability of **"Decompose"** and **"Resolve"** suggests these reasoning steps are consistently minor components of the overall error profile for these tasks.
In summary, while both tasks share a common primary difficulty (Contra Error), their secondary challenges are distinctly different, pointing to variations in task structure, data complexity, or the reasoning skills they primarily test.