## Line Chart: Test Loss vs. Depth
### Overview
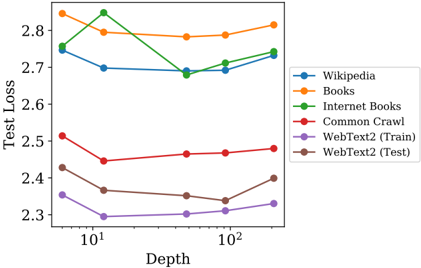
The image is a line chart comparing the test loss of different datasets (Wikipedia, Books, Internet Books, Common Crawl, WebText2 (Train), and WebText2 (Test)) across varying depths. The x-axis represents depth on a logarithmic scale, and the y-axis represents test loss.
### Components/Axes
* **X-axis:** Depth (logarithmic scale). Markers are at approximately 10^1 and 10^2.
* **Y-axis:** Test Loss. Scale ranges from 2.3 to 2.8.
* **Legend:** Located on the right side of the chart.
* Blue: Wikipedia
* Orange: Books
* Green: Internet Books
* Red: Common Crawl
* Purple: WebText2 (Train)
* Brown: WebText2 (Test)
### Detailed Analysis
* **Wikipedia (Blue):** Starts at approximately 2.75 at depth 10^0.5, decreases to around 2.7 at depth 10^1, and then increases to approximately 2.74 at depth 10^2.
* **Books (Orange):** Starts at approximately 2.85 at depth 10^0.5, increases to around 2.9 at depth 10^1, and then decreases to approximately 2.78 at depth 10^2.
* **Internet Books (Green):** Starts at approximately 2.75 at depth 10^0.5, increases to around 2.85 at depth 10^1, and then decreases to approximately 2.72 at depth 10^2.
* **Common Crawl (Red):** Starts at approximately 2.5 at depth 10^0.5, decreases to around 2.45 at depth 10^1, and then increases to approximately 2.48 at depth 10^2.
* **WebText2 (Train) (Purple):** Starts at approximately 2.35 at depth 10^0.5, decreases to around 2.3 at depth 10^1, and then increases to approximately 2.32 at depth 10^2.
* **WebText2 (Test) (Brown):** Starts at approximately 2.43 at depth 10^0.5, decreases to around 2.35 at depth 10^1, and then increases to approximately 2.4 at depth 10^2.
### Key Observations
* The "Books" dataset has the highest test loss across all depths.
* The "WebText2 (Train)" dataset has the lowest test loss across all depths.
* All datasets show a general trend of decreasing test loss from depth 10^0.5 to 10^1, followed by an increase from depth 10^1 to 10^2.
### Interpretation
The chart illustrates how the test loss varies with depth for different datasets. The general trend suggests that increasing depth initially reduces test loss, but beyond a certain point, it starts to increase, potentially indicating overfitting. The relative performance of the datasets varies, with "Books" consistently showing the highest test loss and "WebText2 (Train)" the lowest. This could be due to differences in the size, quality, or nature of the data in each dataset. The logarithmic scale on the x-axis suggests that the impact of depth changes diminishes as depth increases.