TECHNICAL ASSET FINGERPRINT
0a118128f1de72f73718bfce
Click to view fullscreen
Press ESC or click to close
FOUND IN PAPERS
EXPERT: healer-alpha-free VERSION 1
RUNTIME: free/openrouter/healer-alpha
INTEL_VERIFIED
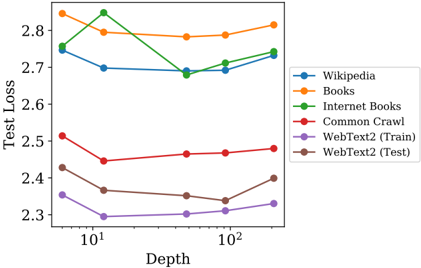
## Line Chart: Test Loss vs. Depth for Various Text Datasets
### Overview
This is a line chart plotting "Test Loss" on the y-axis against "Depth" on the x-axis. The chart compares the performance (measured by loss) of a model or system as its depth increases, across six different text datasets. The x-axis uses a logarithmic scale.
### Components/Axes
* **Chart Type:** Line chart with markers.
* **X-Axis:**
* **Label:** "Depth"
* **Scale:** Logarithmic (base 10).
* **Major Ticks/Markers:** `10^1` (10) and `10^2` (100). The axis spans from approximately 5 to 200.
* **Y-Axis:**
* **Label:** "Test Loss"
* **Scale:** Linear.
* **Range:** Approximately 2.3 to 2.85.
* **Major Ticks:** 2.3, 2.4, 2.5, 2.6, 2.7, 2.8.
* **Legend:**
* **Position:** Centered vertically on the right side of the plot area.
* **Content:** Six entries, each with a colored line/marker and a text label.
* **Entries (from top to bottom as listed in legend):**
1. **Wikipedia** (Blue line, circle marker)
2. **Books** (Orange line, circle marker)
3. **Internet Books** (Green line, circle marker)
4. **Common Crawl** (Red line, circle marker)
5. **WebText2 (Train)** (Purple line, circle marker)
6. **WebText2 (Test)** (Brown line, circle marker)
### Detailed Analysis
The chart displays six data series. Below is an analysis of each, following the trend verification and spatial grounding protocol.
1. **Wikipedia (Blue)**
* **Trend:** Starts high, dips to a minimum, then shows a slight upward trend at greater depths.
* **Data Points (Approximate):**
* Depth ~5: Loss ≈ 2.76
* Depth ~10: Loss ≈ 2.70
* Depth ~50: Loss ≈ 2.69
* Depth ~100: Loss ≈ 2.70
* Depth ~200: Loss ≈ 2.74
2. **Books (Orange)**
* **Trend:** Starts as the highest loss, decreases initially, then gradually increases, ending as the highest loss again.
* **Data Points (Approximate):**
* Depth ~5: Loss ≈ 2.84 (Highest initial point)
* Depth ~10: Loss ≈ 2.80
* Depth ~50: Loss ≈ 2.78
* Depth ~100: Loss ≈ 2.79
* Depth ~200: Loss ≈ 2.82
3. **Internet Books (Green)**
* **Trend:** Shows the most volatile pattern. Starts high, peaks sharply, drops significantly, then recovers slightly.
* **Data Points (Approximate):**
* Depth ~5: Loss ≈ 2.75
* Depth ~10: Loss ≈ 2.85 (Peak, highest overall point on chart)
* Depth ~50: Loss ≈ 2.68 (Lowest point for this series)
* Depth ~100: Loss ≈ 2.71
* Depth ~200: Loss ≈ 2.75
4. **Common Crawl (Red)**
* **Trend:** Starts in the middle range, dips, then shows a very gradual, consistent upward trend.
* **Data Points (Approximate):**
* Depth ~5: Loss ≈ 2.51
* Depth ~10: Loss ≈ 2.45
* Depth ~50: Loss ≈ 2.46
* Depth ~100: Loss ≈ 2.47
* Depth ~200: Loss ≈ 2.48
5. **WebText2 (Train) (Purple)**
* **Trend:** Consistently the lowest loss series. Shows a shallow U-shape: decreases to a minimum and then slowly increases.
* **Data Points (Approximate):**
* Depth ~5: Loss ≈ 2.36
* Depth ~10: Loss ≈ 2.30 (Lowest point on the entire chart)
* Depth ~50: Loss ≈ 2.31
* Depth ~100: Loss ≈ 2.32
* Depth ~200: Loss ≈ 2.33
6. **WebText2 (Test) (Brown)**
* **Trend:** Follows a similar U-shape pattern to its training counterpart but at a higher loss level. Decreases to a minimum and then increases more sharply at the end.
* **Data Points (Approximate):**
* Depth ~5: Loss ≈ 2.43
* Depth ~10: Loss ≈ 2.37
* Depth ~50: Loss ≈ 2.35
* Depth ~100: Loss ≈ 2.34 (Minimum for this series)
* Depth ~200: Loss ≈ 2.40
### Key Observations
* **Performance Grouping:** The datasets form two distinct clusters. "Wikipedia," "Books," and "Internet Books" operate in a higher loss band (≈2.68-2.85). "Common Crawl," "WebText2 (Train)," and "WebText2 (Test)" operate in a lower loss band (≈2.30-2.51).
* **Optimal Depth:** Most series exhibit a minimum loss at an intermediate depth (between 10 and 100), suggesting a "sweet spot" before potential overfitting or diminishing returns cause loss to rise again with greater depth.
* **Volatility:** "Internet Books" (green) shows the most dramatic fluctuation, with a sharp peak at depth 10. "Books" (orange) and "Wikipedia" (blue) are the most stable at higher losses.
* **Train-Test Gap:** The "WebText2" series shows a consistent gap between the training (purple) and test (brown) loss, with the test loss being higher, as expected. The gap appears relatively stable across depths.
### Interpretation
This chart likely illustrates the relationship between model depth (complexity) and generalization performance (test loss) when trained on different text corpora. The data suggests several insights:
1. **Data Quality/Difficulty:** The consistent separation into two loss clusters implies intrinsic differences in the datasets. The lower-loss group (Common Crawl, WebText2) may represent more uniform, predictable, or higher-quality text data for the given task, while the higher-loss group (Wikipedia, Books) might be more diverse, complex, or contain more noise.
2. **Depth and Generalization:** The U-shaped curves for most datasets indicate a classic bias-variance tradeoff. Initially, increasing depth reduces underfitting (loss decreases). Beyond an optimal point, increased model complexity may lead to overfitting on the training data, causing test loss to rise. The optimal depth varies by dataset.
3. **Anomaly - Internet Books:** The sharp peak for "Internet Books" at depth 10 is an outlier. This could indicate a specific instability in training at that configuration for that dataset, or it might be an artifact of the specific model architecture or training run. It warrants further investigation.
4. **Practical Implication:** There is no single "best" depth. The optimal model complexity is dataset-dependent. For the lower-loss datasets, a depth around 50-100 appears favorable. For the higher-loss datasets, the optimum is less clear, with performance being more stable across a wider range of depths.
In summary, the chart provides a technical comparison showing that model depth must be tuned per dataset, and that the nature of the training data is a primary determinant of achievable performance.
DECODING INTELLIGENCE...